
Compare Schaeffler India with Similar Stocks
Dashboard
High Management Efficiency with a high ROE of 19.25%
The company is Net-Debt Free
The company has declared Positive results for the last 6 consecutive quarters
With ROE of 20.4, it has a Very Expensive valuation with a 10.3 Price to Book Value
High Institutional Holdings at 20.58%
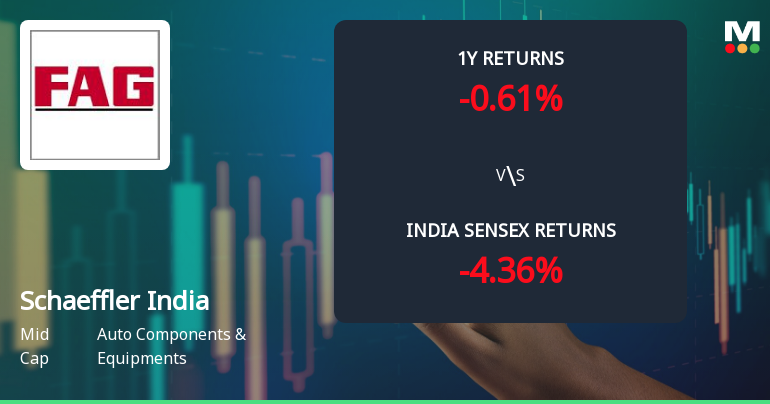
Consistent Underperformance against the benchmark over the last 3 years
Stock DNA
Auto Components & Equipments
INR 63,698 Cr (Mid Cap)
50.00
46
0.86%
-0.24
20.39%
10.30
Total Returns (Price + Dividend) 
Latest dividend: 34.958955223880594 per share ex-dividend date: Apr-23-2026
Risk Adjusted Returns v/s
Returns Beta

News
Schaeffler India Ltd Technical Momentum Shifts Amid Sideways Trend
Schaeffler India Ltd has experienced a notable shift in its technical momentum, moving from a mildly bullish stance to a sideways trend, reflecting a complex interplay of technical indicators. Despite a recent downgrade in daily price performance, the stock’s medium-term outlook remains nuanced, with mixed signals from MACD, RSI, and moving averages suggesting cautious investor sentiment in the auto components sector.
Read full news article
Schaeffler India Ltd is Rated Hold by MarketsMOJO
Schaeffler India Ltd is rated 'Hold' by MarketsMOJO, with this rating last updated on 14 July 2026. While the rating change occurred on that date, the analysis and financial metrics discussed here reflect the stock's current position as of 26 July 2026, providing investors with the latest insights into the company’s performance and outlook.
Read full news articleAre Schaeffler India Ltd latest results good or bad?
Schaeffler India Ltd's latest financial results for Q1 FY27 demonstrate a complex operational landscape. The company reported a net profit of ₹325.78 crores, reflecting a sequential growth of 3.07% from the previous quarter and a year-on-year increase of 13.47%. Revenue for the quarter reached ₹2,760.55 crores, marking a 6.76% rise quarter-on-quarter and a notable 17.34% growth compared to the same period last year. This performance underscores the company's ability to capture market share and navigate a challenging environment characterized by rising input costs. However, the operating margin (excluding other income) contracted to 18.08%, down from 18.50% in the previous quarter, indicating ongoing cost management challenges. The profit after tax (PAT) margin also saw a decrease to 11.80% from 12.22%, primarily due to a significant rise in employee costs, which increased by 9.12% quarter-on-quarter. This ...
Read full news article Announcements
Announcement under Regulation 30 (LODR)-Earnings Call Transcript
28-Jul-2026 | Source : BSETranscript of Analyst call held on July 23 2026
Announcement under Regulation 30 (LODR)-Analyst / Investor Meet - Outcome
23-Jul-2026 | Source : BSEAudio Recording of the Analyst Call held on July 23 2026
Announcement under Regulation 30 (LODR)-Investor Presentation
23-Jul-2026 | Source : BSEInvestor Presentation
Corporate Actions

No Upcoming Board Meetings

Schaeffler India Ltd has declared 1750% dividend, ex-date: 23 Apr 26

Schaeffler India Ltd has announced 2:10 stock split, ex-date: 08 Feb 22

No Bonus history available

No Rights history available
Quality key factors
Valuation key factors
Technicals key factors
 Technical Indicator Scale: Bearish, Mildly Bearish, Sideways, Mildly Bullish, Bullish Turned
 Shareholding Snapshot : Jun 2026
Shareholding Compare (%holding)
Promoters
None
Held by 34 Schemes (14.94%)
Held by 171 FIIs (4.36%)
Schaeffler Schweinfurt Beteiligungs Gmbh (27.28%)
Kotak Midcap Fund (3.27%)
4.3%
Quarterly Results Snapshot (Consolidated) - Jun'26 - QoQ

QoQ Growth in quarter ended Jun 2026 is 6.76% vs -5.09% in Mar 2026
QoQ Growth in quarter ended Jun 2026 is 3.07% vs -1.95% in Mar 2026
Half Yearly Results Snapshot (Consolidated) - Jun'26
Growth in half year ended Jun 2026 is 18.10% vs 13.74% in Jun 2025
Growth in half year ended Jun 2026 is 19.14% vs 15.81% in Jun 2025
Nine Monthly Results Snapshot (Consolidated) - Sep'25
YoY Growth in nine months ended Sep 2025 is 14.19% vs 13.39% in Sep 2024
YoY Growth in nine months ended Sep 2025 is 18.02% vs 1.77% in Sep 2024
Annual Results Snapshot (Consolidated) - Dec'25
YoY Growth in year ended Dec 2025 is 17.66% vs 13.54% in Dec 2024
YoY Growth in year ended Dec 2025 is 22.53% vs 4.43% in Dec 2024
About Schaeffler India Ltd

Company Coordinates


