
Compare BN Agrochem with Similar Stocks
Dashboard
Weak Long Term Fundamental Strength with an average Return on Equity (ROE) of 6.57%
- Low ability to service debt as the company has a high Debt to EBITDA ratio of 2.29 times
With ROE of 7.3, it has a Very Expensive valuation with a 5.6 Price to Book Value
Despite the size of the company, domestic mutual funds hold only 0% of the company
Stock DNA
Trading & Distributors
INR 2,699 Cr (Small Cap)
77.00
21
0.00%
0.08
7.32%
5.63
Total Returns (Price + Dividend) 
BN Agrochem for the last several years.
Risk Adjusted Returns v/s
Returns Beta

News
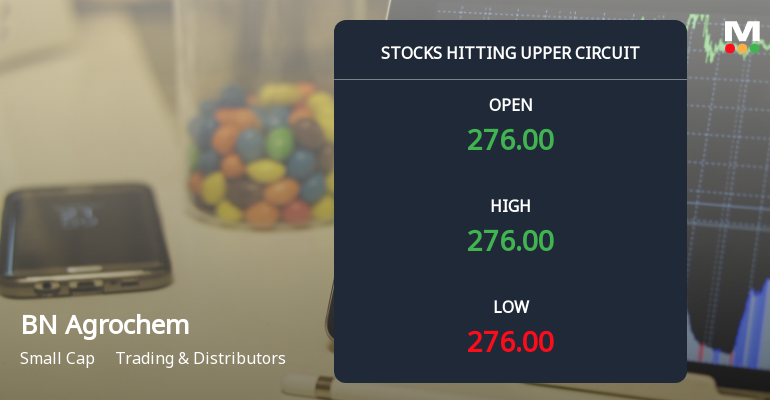
BN Agrochem Ltd Locks at Upper Circuit With 5.0% Gain — Buyers Queue, Sellers Absent
At Rs 278.35, the buying was done — not because demand dried up, but because the exchange wouldn't let the stock go any higher. BN Agrochem Ltd locked at its upper circuit of 5.0% on 25 Jun 2026, with buyers queuing and no sellers willing to part with shares.
Read full news article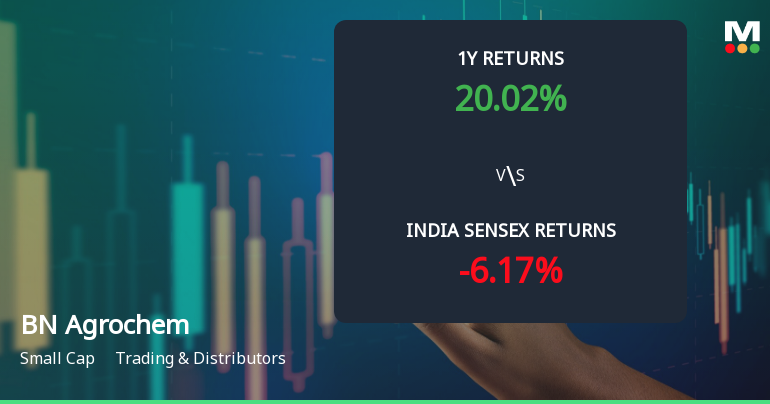
BN Agrochem Ltd Faces Technical Momentum Shift Amid Bearish Signals
BN Agrochem Ltd, a small-cap player in the Trading & Distributors sector, has experienced a notable shift in its technical momentum, with key indicators signalling a transition from mildly bullish to mildly bearish trends. The stock’s recent price action and technical parameters suggest increasing caution for investors amid a challenging market backdrop.
Read full news article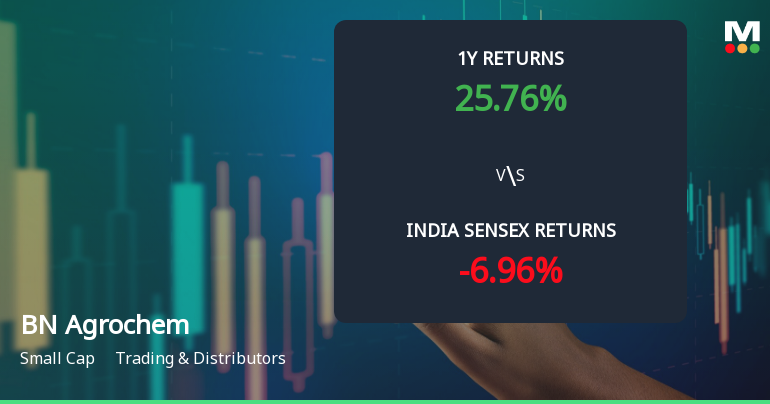
BN Agrochem Ltd Technical Momentum Shifts Amid Mixed Market Signals
BN Agrochem Ltd has experienced a notable shift in its technical momentum, moving from a mildly bearish stance to a mildly bullish trend on the weekly charts. Despite this positive change, the stock continues to face mixed signals from key technical indicators, reflecting a complex outlook for investors navigating the small-cap Trading & Distributors sector.
Read full news article Announcements
Announcement Under Regulation 30 Of SEBI (LODR) 2015- Updates On Scheme Of Amalgamation
22-Jun-2026 | Source : BSEPursuant to Regulation 30 as per SEBI (LODR) Regulation 2015 please find attached an update on scheme of amalgamation.
Announcement under Regulation 30 (LODR)-Meeting Updates
29-May-2026 | Source : BSEPursuant to Regulation 30 of SEBI LODR 2015 please find attached decisions taken by Board of Directors in their meeting held today.
Results- Financial Results For March 31 2026
29-May-2026 | Source : BSEThe Board of directors in their meeting held today considered and approved the financial results (Standalone and Consolidated) for the year ended March 31 2026.
Corporate Actions

No Upcoming Board Meetings

No Dividend history available

No Splits history available

No Bonus history available

No Rights history available
Quality key factors
Valuation key factors
Technicals key factors
 Technical Indicator Scale: Bearish, Mildly Bearish, Sideways, Mildly Bullish, Bullish Turned
 Shareholding Snapshot : Mar 2026
Shareholding Compare (%holding)
Non Institution
None
Held by 0 Schemes
Held by 1 FIIs (0.0%)
Anubhav Agarwal (5.93%)
Global Focus Fund (18.34%)
3.24%
Quarterly Results Snapshot (Consolidated) - Mar'26 - YoY

YoY Growth in quarter ended Mar 2026 is 22.02% vs 2,921.02% in Mar 2025
YoY Growth in quarter ended Mar 2026 is -84.68% vs 2,215.38% in Mar 2025
Half Yearly Results Snapshot (Consolidated) - Sep'25
Growth in half year ended Sep 2025 is 0.00% vs 0.00% in Sep 2024

Growth in half year ended Sep 2025 is 599.34% vs -692.71% in Sep 2024
Nine Monthly Results Snapshot (Consolidated) - Dec'25
YoY Growth in nine months ended Dec 2025 is 618.05% vs 0.00% in Dec 2024
YoY Growth in nine months ended Dec 2025 is 1,158.87% vs 211.71% in Dec 2024
Annual Results Snapshot (Consolidated) - Mar'26
YoY Growth in year ended Mar 2026 is 191.67% vs 4,122.99% in Mar 2025
YoY Growth in year ended Mar 2026 is 73.94% vs 731.31% in Mar 2025
About BN Agrochem Ltd

Company Coordinates


