
Compare Kesar Enterprise with Similar Stocks
Stock DNA
Sugar
INR 68 Cr (Micro Cap)
NA (Loss Making)
20
0.00%
0.06
-40.79%
0.56
Total Returns (Price + Dividend) 
Latest dividend: 0.6700 per share ex-dividend date: Nov-08-2011
Risk Adjusted Returns v/s
Returns Beta

News
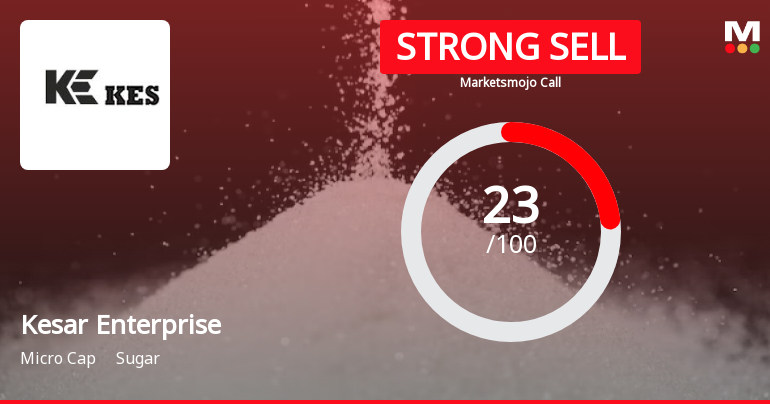
Kesar Enterprises Ltd is Rated Strong Sell
Kesar Enterprises Ltd is rated Strong Sell by MarketsMOJO, with this rating last updated on 07 Oct 2025. However, the analysis and financial metrics discussed here reflect the company’s current position as of 29 June 2026, providing investors with the latest insights into the stock’s fundamentals, valuation, financial trends, and technical outlook.
Read full news article
Kesar Enterprises Ltd is Rated Strong Sell
Kesar Enterprises Ltd is rated Strong Sell by MarketsMOJO, with this rating last updated on 07 Oct 2025. However, the analysis and financial metrics discussed below reflect the company’s current position as of 17 June 2026, providing investors with an up-to-date view of the stock’s fundamentals, valuation, financial trends, and technical outlook.
Read full news articleAre Kesar Enterprises Ltd latest results good or bad?
Kesar Enterprises Ltd's latest financial results for Q4 FY26 reveal a complex picture of substantial revenue growth amid ongoing profitability challenges. The company reported net sales of ₹166.32 crores, reflecting a significant year-on-year increase of 163.21% from ₹63.19 crores in Q4 FY25, marking the highest quarterly revenue in recent operational history. This growth is primarily attributed to seasonal demand dynamics within the sugar industry. However, despite this impressive revenue surge, Kesar Enterprises continues to face substantial operational difficulties. The company recorded a net loss of ₹7.34 crores for the quarter, which, while an improvement from the previous year's loss of ₹16.36 crores, underscores persistent profitability issues. The operating margin was reported at -3.68%, an improvement from -13.07% year-on-year, yet still indicative of negative operating profitability. The overall ...
Read full news article Announcements
Compliances-Certificate under Reg. 74 (5) of SEBI (DP) Regulations 2018
07-Jul-2026 | Source : BSECertificate under Reg.74(5) of the SBEI (DP) Regulations 2018 is enclosed herewith.
Closure of Trading Window
23-Jun-2026 | Source : BSENotice of Closure of Trading Window is attached herewith.
Announcement under Regulation 30 (LODR)-Newspaper Publication
01-Jun-2026 | Source : BSEThe audited results for the quarter and year ended 31.03.2026 published in the newspaper are attached herewith.
Corporate Actions

No Upcoming Board Meetings

Kesar Enterprises Ltd has declared 10% dividend, ex-date: 08 Nov 11

Kesar Enterprises Ltd has announced 1:10 stock split, ex-date: 18 Sep 25

No Bonus history available

No Rights history available
Quality key factors
Valuation key factors
Technicals key factors
 Technical Indicator Scale: Bearish, Mildly Bearish, Sideways, Mildly Bullish, Bullish Turned
 Shareholding Snapshot : Mar 2026
Shareholding Compare (%holding)
Promoters
None
Held by 0 Schemes
Held by 0 FIIs
Seel Investment Pvt Ltd (32.0%)
Shah Bhadreshkumar (3.13%)
20.78%
Quarterly Results Snapshot (Standalone) - Mar'26 - QoQ

QoQ Growth in quarter ended Mar 2026 is 59.45% vs 663.62% in Dec 2025
QoQ Growth in quarter ended Mar 2026 is -17.82% vs 68.00% in Dec 2025
Half Yearly Results Snapshot (Standalone) - Sep'25
Growth in half year ended Sep 2025 is -68.35% vs -43.02% in Sep 2024

Growth in half year ended Sep 2025 is 13.01% vs -23.30% in Sep 2024
Nine Monthly Results Snapshot (Standalone) - Dec'25
YoY Growth in nine months ended Dec 2025 is -48.97% vs -23.05% in Dec 2024
YoY Growth in nine months ended Dec 2025 is 26.98% vs -34.98% in Dec 2024
Annual Results Snapshot (Standalone) - Mar'26
YoY Growth in year ended Mar 2026 is -8.82% vs -37.11% in Mar 2025
YoY Growth in year ended Mar 2026 is 33.34% vs -186.88% in Mar 2025
About Kesar Enterprises Ltd

Company Coordinates


