
Compare Indus Finance with Similar Stocks
Dashboard
Weak Long Term Fundamental Strength with an average Return on Equity (ROE) of 4.69%
With a growth in Net Profit of 403.45%, the company declared Very Positive results in Mar 26
With ROE of 10.7, it has a Very Expensive valuation with a 5.7 Price to Book Value
Majority shareholders : Promoters
Market Beating performance in long term as well as near term
Stock DNA
Non Banking Financial Company (NBFC)
INR 138 Cr (Micro Cap)
54.00
22
0.78%
0.48
10.68%
5.71
Total Returns (Price + Dividend) 
Latest dividend: 0.6 per share ex-dividend date: Jul-03-2026
Risk Adjusted Returns v/s
Returns Beta

News

Broad-Based Technical Strength Lifts Indus Finance Ltd to 52-Week High of Rs 148.8
Surging past its previous peaks, Indus Finance Ltd touched a new 52-week high of Rs 148.8 on 6 Jul 2026, marking a remarkable rally from its low of Rs 37.66 just a year ago. This impressive price momentum is underpinned by a confluence of bullish technical indicators and sustained gains over the past week.
Read full news article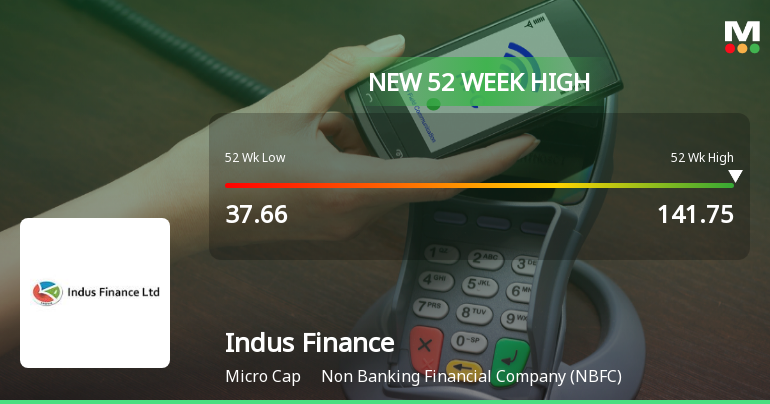
Broad-Based Technical Strength Lifts Indus Finance Ltd to 52-Week High of Rs 141.75
From a low of Rs 37.66 to a new peak of Rs 141.75, Indus Finance Ltd has surged an impressive 273.7% over the past year, vastly outperforming the Sensex’s decline of 6.58%. This remarkable rally culminated in the stock hitting a fresh 52-week high on 3 Jul 2026, fuelled by a confluence of strong technical signals and sustained price momentum.
Read full news article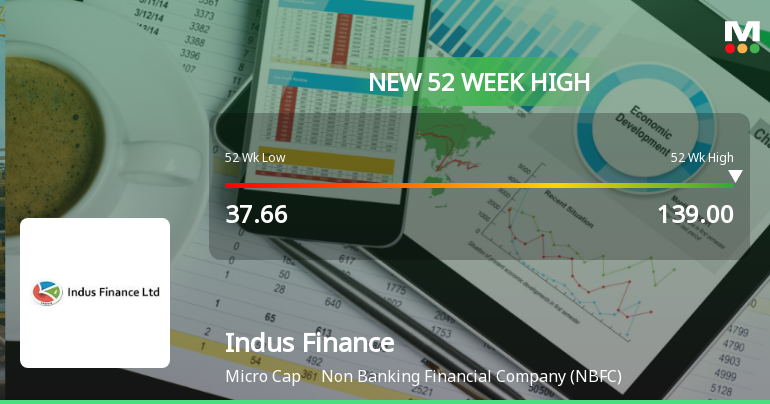
Broad-Based Technical Strength Lifts Indus Finance Ltd to 52-Week High of Rs 139
With a remarkable surge to Rs 139 on 2 Jul 2026, Indus Finance Ltd has reached a new 52-week high, marking a 178.0% gain over the past year. This milestone reflects a powerful alignment of technical indicators and sustained price momentum that has propelled the stock well ahead of the broader market's modest gains.
Read full news article Announcements
Reg. 34 (1) Annual Report.
17-Jun-2026 | Source : BSEDear sir/madam PFA Annual report for fy 25-26.
Board Meeting Outcome for OUTCOME OF BOARD MEETING HELD ON 06.05.2026
06-May-2026 | Source : BSEDear sir/madam PFA outcome of Board meeting held on 06th May 2026.
AUDITED FINANCIAL RESULTS OUTCOME 31.03.2026
06-May-2026 | Source : BSEDear sir/madam PFA outcome of Audited financial results as on 31.03.2026.
Corporate Actions

No Upcoming Board Meetings

Indus Finance Ltd has declared 6% dividend, ex-date: 03 Jul 26

No Splits history available

Indus Finance Ltd has announced 1:1 bonus issue, ex-date: 03 May 11

No Rights history available
Quality key factors
Valuation key factors
Technicals key factors
 Technical Indicator Scale: Bearish, Mildly Bearish, Sideways, Mildly Bullish, Bullish Turned
 Shareholding Snapshot : Mar 2026
Shareholding Compare (%holding)
Promoters
None
Held by 0 Schemes
Held by 0 FIIs
Soura Investments Holdings Private Limited (29.17%)
Commendam Investments Private Limited (8.26%)
14.32%
Quarterly Results Snapshot (Standalone) - Mar'26 - QoQ

QoQ Growth in quarter ended Mar 2026 is 315.33% vs 30.48% in Dec 2025
QoQ Growth in quarter ended Mar 2026 is 403.45% vs 262.50% in Dec 2025
Half Yearly Results Snapshot (Standalone) - Sep'25

Growth in half year ended Sep 2025 is -27.18% vs 238.64% in Sep 2024
Growth in half year ended Sep 2025 is -69.77% vs 100.00% in Sep 2024
Nine Monthly Results Snapshot (Standalone) - Dec'25
YoY Growth in nine months ended Dec 2025 is -21.16% vs 191.56% in Dec 2024
YoY Growth in nine months ended Dec 2025 is -44.44% vs 86.79% in Dec 2024
Annual Results Snapshot (Standalone) - Mar'26
YoY Growth in year ended Mar 2026 is 68.43% vs 66.06% in Mar 2025
YoY Growth in year ended Mar 2026 is 86.11% vs 44.00% in Mar 2025
About Indus Finance Ltd

Company Coordinates


