
Compare Indus Finance with Similar Stocks
Dashboard
Weak Long Term Fundamental Strength with an average Return on Equity (ROE) of 4.69%
With a growth in Net Profit of 403.45%, the company declared Very Positive results in Mar 26
With ROE of 10.7, it has a Very Expensive valuation with a 6.2 Price to Book Value
Majority shareholders : Promoters
Consistent Returns over the last 3 years
Stock DNA
Non Banking Financial Company (NBFC)
INR 141 Cr (Micro Cap)
58.00
21
0.41%
0.48
10.68%
5.87
Total Returns (Price + Dividend) 
Latest dividend: 0.6 per share ex-dividend date: Jul-03-2026
Risk Adjusted Returns v/s
Returns Beta

News
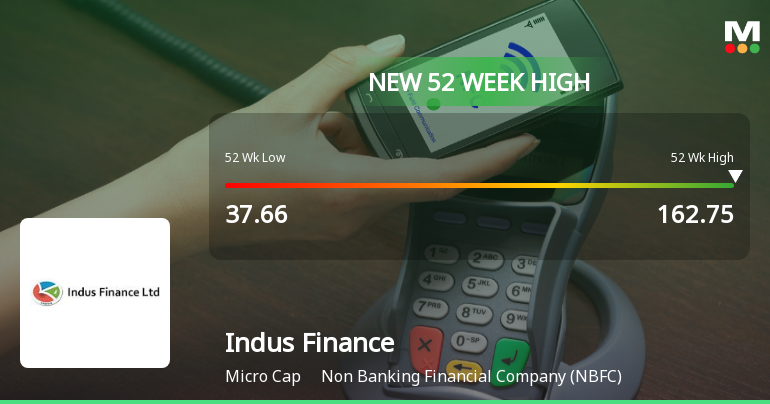
Broad-Based Technical Strength Lifts Indus Finance Ltd to 52-Week High of Rs 162.75
Surging past its previous peaks, Indus Finance Ltd reached a fresh 52-week high of Rs 162.75 on 09 Jul 2026, marking a remarkable rally of over 316% from its 52-week low of Rs 37.66. This milestone caps an impressive eight-day winning streak, during which the stock gained 24.14%, outpacing its sector by 4.65% in a market environment where the Sensex climbed 0.69%.
Read full news article
Indus Finance Ltd is Rated Hold by MarketsMOJO
Indus Finance Ltd is rated 'Hold' by MarketsMOJO, with this rating last updated on 06 May 2026. However, the analysis and financial metrics discussed here reflect the stock's current position as of 08 July 2026, providing investors with the latest insights into its performance and outlook.
Read full news article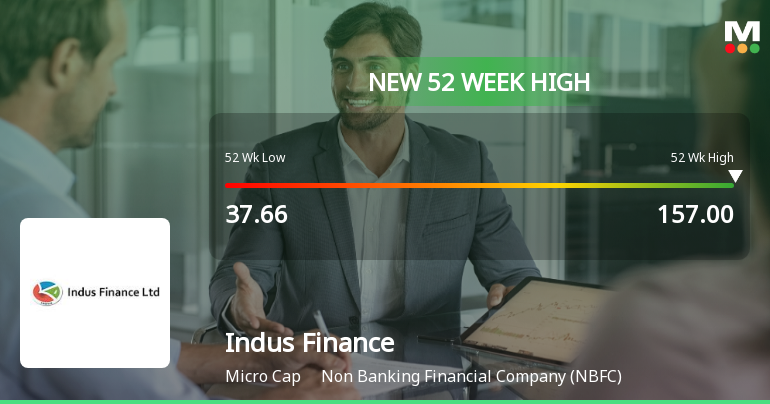
Broad-Based Technical Strength Lifts Indus Finance Ltd to 52-Week High of Rs 157
Surging to a new 52-week high of Rs 157 on 8 Jul 2026, Indus Finance Ltd has demonstrated remarkable price momentum, outperforming its sector and the broader market despite a declining Sensex. This milestone caps a spectacular 183.02% rally over the past year, underscoring the stock’s strong technical foundation and sustained upward trajectory.
Read full news article Announcements
Shareholder Meeting / Postal Ballot-Scrutinizers Report
14-Jul-2026 | Source : BSEDear sir/madam Please find the attached voting results along with Scrutinisers report of Indus Finance Limited.
Shareholder Meeting / Postal Ballot-Outcome of AGM
10-Jul-2026 | Source : BSEDear sir/madam PFA the proceedings of Annual General Meeting of Indus Finance Limited held on 10th July 2026
Compliances-Certificate under Reg. 74 (5) of SEBI (DP) Regulations 2018
09-Jul-2026 | Source : BSEDear sir/madam PFA the Certificate under Reg 74(5) of SEBI(DP) Regulations2018
Corporate Actions

No Upcoming Board Meetings

Indus Finance Ltd has declared 6% dividend, ex-date: 03 Jul 26

No Splits history available

Indus Finance Ltd has announced 1:1 bonus issue, ex-date: 03 May 11

No Rights history available
Quality key factors
Valuation key factors
Technicals key factors
 Technical Indicator Scale: Bearish, Mildly Bearish, Sideways, Mildly Bullish, Bullish Turned
 Shareholding Snapshot : Mar 2026
Shareholding Compare (%holding)
Promoters
None
Held by 0 Schemes
Held by 0 FIIs
Soura Investments Holdings Private Limited (29.17%)
Commendam Investments Private Limited (8.26%)
14.32%
Quarterly Results Snapshot (Standalone) - Mar'26 - QoQ

QoQ Growth in quarter ended Mar 2026 is 315.33% vs 30.48% in Dec 2025
QoQ Growth in quarter ended Mar 2026 is 403.45% vs 262.50% in Dec 2025
Half Yearly Results Snapshot (Standalone) - Sep'25

Growth in half year ended Sep 2025 is -27.18% vs 238.64% in Sep 2024
Growth in half year ended Sep 2025 is -69.77% vs 100.00% in Sep 2024
Nine Monthly Results Snapshot (Standalone) - Dec'25
YoY Growth in nine months ended Dec 2025 is -21.16% vs 191.56% in Dec 2024
YoY Growth in nine months ended Dec 2025 is -44.44% vs 86.79% in Dec 2024
Annual Results Snapshot (Standalone) - Mar'26
YoY Growth in year ended Mar 2026 is 68.43% vs 66.06% in Mar 2025
YoY Growth in year ended Mar 2026 is 86.11% vs 44.00% in Mar 2025
About Indus Finance Ltd

Company Coordinates


