
Compare Solar Industries with Similar Stocks
Dashboard
Strong Long Term Fundamental Strength with an average Return on Capital Employed (ROCE) of 32.70%
- Healthy long term growth as Net Sales has grown by an annual rate of 31.36% and Operating profit at 41.29%
- Strong ability to service debt as the company has a low Debt to EBITDA ratio of 0.58 times
The company has declared Positive results for the last 8 consecutive quarters
Majority shareholders : Promoters
Consistent Returns over the last 3 years
With its market cap of Rs 1,66,230 cr, it is the biggest company in the sector and constitutes 24.57% of the entire sector
Stock DNA
Other Chemical products
INR 166,727 Cr (Large Cap)
99.00
44
0.06%
0.15
26.72%
26.48
Total Returns (Price + Dividend) 
Latest dividend: 11.000934605053992 per share ex-dividend date: Jul-28-2026
Risk Adjusted Returns v/s
Returns Beta

News

Solar Industries India Ltd Technical Momentum Shifts to Bullish Amid Strong Market Returns
Solar Industries India Ltd has exhibited a notable shift in its technical momentum, moving from a mildly bullish stance to a more confident bullish trend. This transition is supported by a confluence of technical indicators including MACD, moving averages, and Bollinger Bands, signalling renewed investor interest and potential upside in the stock’s price trajectory.
Read full news article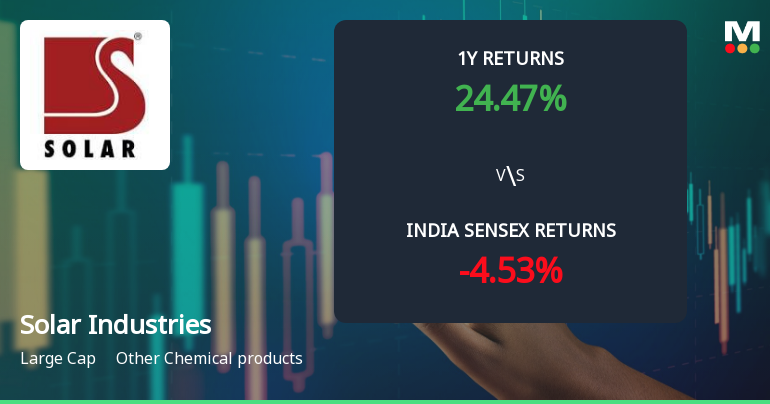
Solar Industries India Ltd Sees Technical Momentum Shift Amid Mixed Indicator Signals
Solar Industries India Ltd, a prominent player in the Other Chemical products sector, has experienced a subtle shift in its technical momentum, moving from a bullish to a mildly bullish stance. Despite a slight dip in the daily price, the stock’s broader technical indicators present a nuanced picture, reflecting both resilience and caution for investors navigating the current market environment.
Read full news article
Solar Industries India Ltd is Rated Buy
Solar Industries India Ltd is rated 'Buy' by MarketsMOJO, with this rating last updated on 15 May 2026. However, the analysis and financial metrics presented here reflect the stock's current position as of 28 July 2026, providing investors with the latest insights into its performance and outlook.
Read full news article Announcements
Letter To The Shareholders - Annual Report FY 2025-26
21-Jul-2026 | Source : BSELetter to the Shareholders - Annual Reports Financial Year 2025-26
Announcement under Regulation 30 (LODR)-Newspaper Publication
21-Jul-2026 | Source : BSENewspaper clippings- 31st Annual General Meeting Information on E-voting Record Date and Final Dividend
Integrated Annual Report For The Financial Year 2025-26 Including Notice Convening The 31St Annual General Meeting (AGM) And Intimation Of Record Date.
20-Jul-2026 | Source : BSEIntegrated Annual Report for the financial year 2025-26 including Notice convening the 31st Annual General Meeting (AGM) and Intimation of Record Date.
Corporate Actions

No Upcoming Board Meetings

Solar Industries India Ltd has declared 550% dividend, ex-date: 28 Jul 26

Solar Industries India Ltd has announced 2:10 stock split, ex-date: 13 Jul 16

No Bonus history available

No Rights history available
Quality key factors
Valuation key factors
Technicals key factors
 Technical Indicator Scale: Bearish, Mildly Bearish, Sideways, Mildly Bullish, Bullish Turned
 Shareholding Snapshot : Jun 2026
Shareholding Compare (%holding)
Promoters
2.2714
Held by 42 Schemes (12.25%)
Held by 400 FIIs (6.4%)
Manish Satyanarayan Nuwal (38.93%)
Sbi Equity Hybrid Fund (3.63%)
5.23%
Quarterly Results Snapshot (Consolidated) - Mar'26 - YoY

YoY Growth in quarter ended Mar 2026 is 40.90% vs 34.51% in Mar 2025
YoY Growth in quarter ended Mar 2026 is 69.95% vs 37.09% in Mar 2025
Half Yearly Results Snapshot (Consolidated) - Sep'25
Growth in half year ended Sep 2025 is 24.58% vs 12.24% in Sep 2024

Growth in half year ended Sep 2025 is 19.45% vs 43.97% in Sep 2024
Nine Monthly Results Snapshot (Consolidated) - Dec'25
YoY Growth in nine months ended Dec 2025 is 26.26% vs 20.52% in Dec 2024
YoY Growth in nine months ended Dec 2025 is 27.36% vs 47.65% in Dec 2024
Annual Results Snapshot (Consolidated) - Mar'26
YoY Growth in year ended Mar 2026 is 30.47% vs 24.23% in Mar 2025
YoY Growth in year ended Mar 2026 is 38.70% vs 44.68% in Mar 2025
About Solar Industries India Ltd

Company Coordinates


