


Key Events This Week
15 Jun: Stock opens strong at ₹17,275.85 (+0.81%)
16 Jun: Technical momentum shifts signal bullish outlook despite 2.20% dip
17 Jun: Intraday high of ₹17,401.05 with 3.04% surge
18 Jun: Technical momentum strengthens with 3.41% gain
19 Jun: Week closes at ₹18,048.90, up 1.57% on the day
Solar Industries India Ltd Technical Momentum Shifts Signal Bullish Outlook
2026-06-18 08:03:11Solar Industries India Ltd has exhibited a notable shift in its technical momentum, moving from a mildly bullish stance to a more confident bullish trend. This transition is underpinned by a confluence of positive signals from key technical indicators including MACD, moving averages, and Bollinger Bands, suggesting a strengthening price momentum that investors should closely monitor.
Read full news article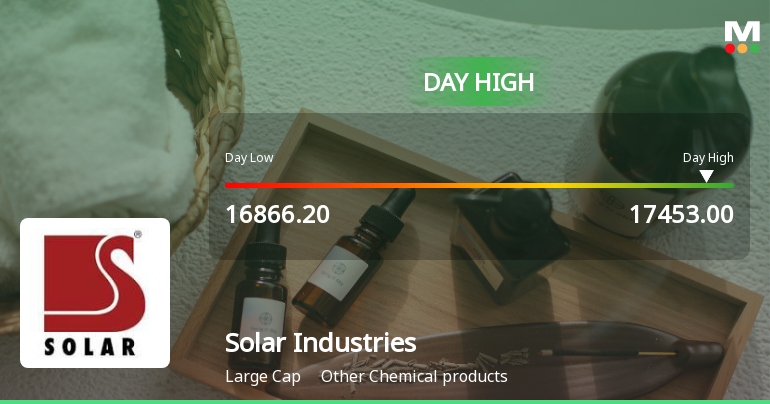
Solar Industries India Ltd Surges 3.04% to Day's High of Rs 17,401 — Outperforms Sector by 1.96 Percentage Points
2026-06-17 13:31:08The Sensex edged higher by 0.22% on 17 Jun 2026, while Solar Industries India Ltd outpaced the broader market with a 3.04% gain, touching an intraday high of Rs 17,401.05. This 1.96 percentage-point outperformance over its sector signals a stock-specific strength rather than a mere market tailwind.
Read full news article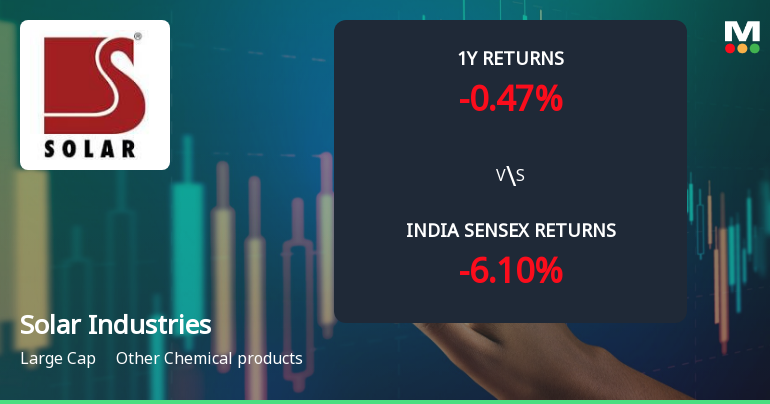
Solar Industries India Ltd Sees Technical Momentum Shift Amid Mixed Market Signals
2026-06-17 08:04:04Solar Industries India Ltd, a prominent player in the Other Chemical products sector, has experienced a notable shift in its technical momentum, moving from a bullish to a mildly bullish stance. Despite a recent dip in price, the stock’s underlying technical indicators present a nuanced picture, reflecting both strength and caution for investors navigating the current market environment.
Read full news article
Solar Industries India Ltd Technical Momentum Shifts Signal Bullish Outlook
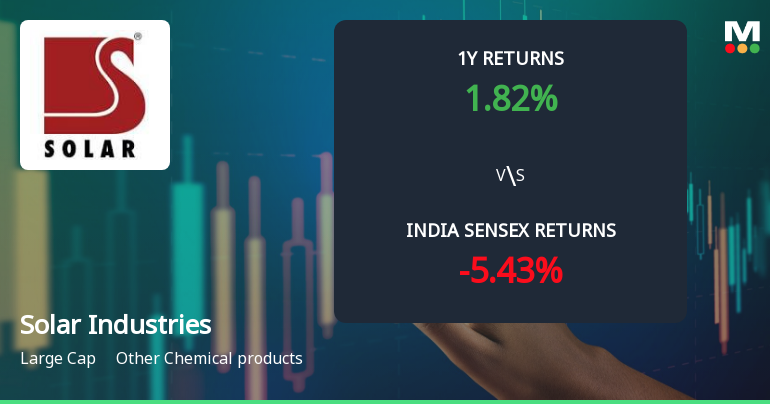
2026-06-16 08:04:35Solar Industries India Ltd has witnessed a notable shift in its technical momentum, moving from a mildly bullish stance to a more confident bullish trend. This change is supported by a confluence of positive signals from key technical indicators such as MACD, moving averages, and Bollinger Bands, alongside robust long-term returns that significantly outperform the broader Sensex benchmark.
Read full news article
Solar Industries India Ltd is Rated Buy
2026-06-14 10:10:04Solar Industries India Ltd is rated 'Buy' by MarketsMOJO, with this rating last updated on 15 May 2026. However, the analysis and financial metrics discussed here reflect the stock's current position as of 14 June 2026, providing investors with an up-to-date view of its performance and prospects.
Read full news article


