
Compare Tahmar Enterp. with Similar Stocks
Dashboard
With a Operating Losses, the company has a Weak Long Term Fundamental Strength
- Poor long term growth as Operating profit has grown by an annual rate -248.20% of over the last 5 years
- Company's ability to service its debt is weak with a poor EBIT to Interest (avg) ratio of -2.95
Negative results in Mar 26
Risky - Negative EBITDA
Underperformed the market in the last 1 year
Stock DNA
Beverages
INR 62 Cr (Micro Cap)
NA (Loss Making)
16
0.00%
0.49
-6.90%
0.73
Total Returns (Price + Dividend) 
Tahmar Enterp. for the last several years.
Risk Adjusted Returns v/s
Returns Beta

News

Tahmar Enterprises Ltd is Rated Strong Sell
Tahmar Enterprises Ltd is rated Strong Sell by MarketsMOJO. This rating was last updated on 17 Feb 2025. However, the analysis and financial metrics presented here reflect the company’s current position as of 02 August 2026, providing investors with the latest insights into its performance and outlook.
Read full news article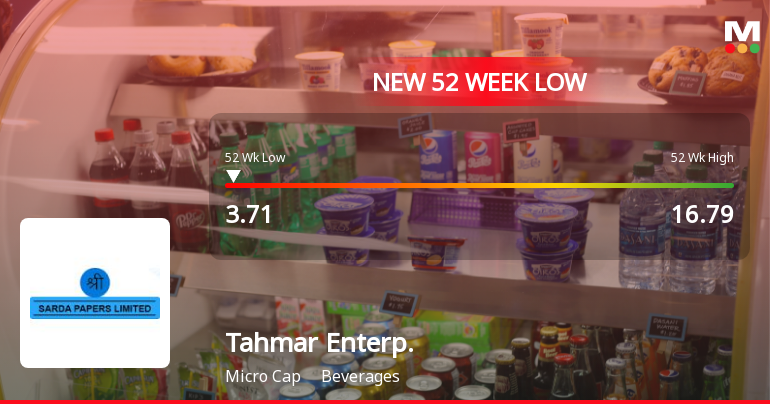
Tahmar Enterprises Ltd Falls to 52-Week Low of Rs 3.71 as Sell-Off Deepens
For the second consecutive session, Tahmar Enterprises Ltd has declined, hitting a fresh 52-week low of Rs 3.71 on 30 Jul 2026, extending its year-long slump to a staggering -70.32% against the Sensex’s modest -4.64% fall.
Read full news article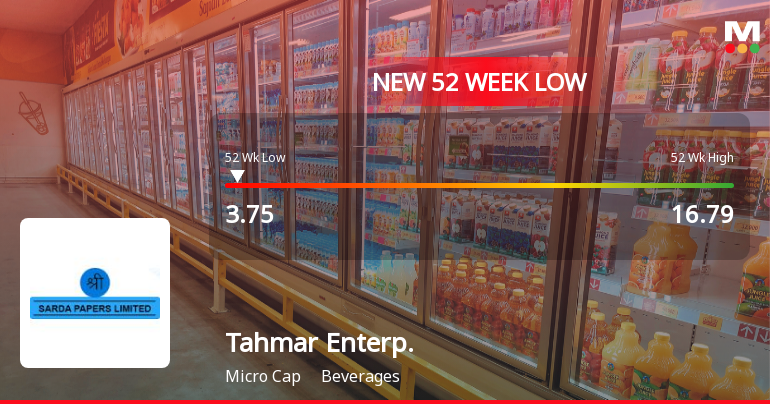
Tahmar Enterprises Ltd Falls to 52-Week Low of Rs 3.75 as Sell-Off Deepens
For the fourth consecutive session, Tahmar Enterprises Ltd has seen its share price decline, culminating in a fresh 52-week low of Rs 3.75 on 23 Jul 2026. This marks a steep 77.7% drop from its 52-week high of Rs 16.79, underscoring a sustained period of selling pressure despite broader market fluctuations.
Read full news article Announcements
Additional Information
14-Jul-2026 | Source : BSEDisclosure under regulation 30
Launch Of The Tahmar Energy Platform And Entry Into A New Line Of Business (Renewable Energy)
10-Jul-2026 | Source : BSEDisclosure of Regulation 30
Receipt Of A Notice Under Section 13(2) Of The SARFAESI Act 2002.
10-Jul-2026 | Source : BSEdisclosure under regulation 30
Corporate Actions

No Upcoming Board Meetings

No Dividend history available

No Splits history available

No Bonus history available

No Rights history available
Quality key factors
Valuation key factors
Technicals key factors
 Technical Indicator Scale: Bearish, Mildly Bearish, Sideways, Mildly Bullish, Bullish Turned
 Shareholding Snapshot : Jun 2026
Shareholding Compare (%holding)
Promoters
None
Held by 0 Schemes
Held by 1 FIIs (0.03%)
Sarita Alice Sequeira (45.95%)
Mastermind Jpin Sme Growth Fund (10.4%)
23.32%
Quarterly Results Snapshot (Standalone) - Mar'26 - YoY

YoY Growth in quarter ended Mar 2026 is -90.32% vs -86.75% in Mar 2025

YoY Growth in quarter ended Mar 2026 is -84.54% vs -921.05% in Mar 2025
Half Yearly Results Snapshot (Standalone) - Sep'25
Growth in half year ended Sep 2025 is -12.74% vs 62.89% in Sep 2024
Growth in half year ended Sep 2025 is -159.46% vs 36.21% in Sep 2024
Nine Monthly Results Snapshot (Standalone) - Dec'25
YoY Growth in nine months ended Dec 2025 is -36.24% vs 14.47% in Dec 2024
YoY Growth in nine months ended Dec 2025 is -187.14% vs 23.08% in Dec 2024
Annual Results Snapshot (Standalone) - Mar'26
YoY Growth in year ended Mar 2026 is -40.57% vs -28.99% in Mar 2025
YoY Growth in year ended Mar 2026 is -114.56% vs -5,320.00% in Mar 2025
About Tahmar Enterprises Ltd

Company Coordinates


