
Compare Bombay Cycle with Similar Stocks
Dashboard
Weak Long Term Fundamental Strength with an average Return on Equity (ROE) of 8.69%
- Poor long term growth as Operating profit has grown by an annual rate 2.34% of over the last 5 years
- Company's ability to service its debt is weak with a poor EBIT to Interest (avg) ratio of 1.67
With ROE of 8.5, it has a Very Expensive valuation with a 2.2 Price to Book Value
Underperformed the market in the last 1 year
Stock DNA
Trading & Distributors
INR 64 Cr (Micro Cap)
26.00
15
0.00%
-0.15
8.46%
2.21
Total Returns (Price + Dividend) 
Latest dividend: 5 per share ex-dividend date: Jul-26-2024
Risk Adjusted Returns v/s
Returns Beta

News

Bombay Cycle & Motor Agency Ltd is Rated Strong Sell
Bombay Cycle & Motor Agency Ltd is rated Strong Sell by MarketsMOJO. This rating was last updated on 04 Nov 2025. However, the analysis and financial metrics presented here reflect the stock’s current position as of 29 June 2026, providing investors with the latest insights into its performance and outlook.
Read full news article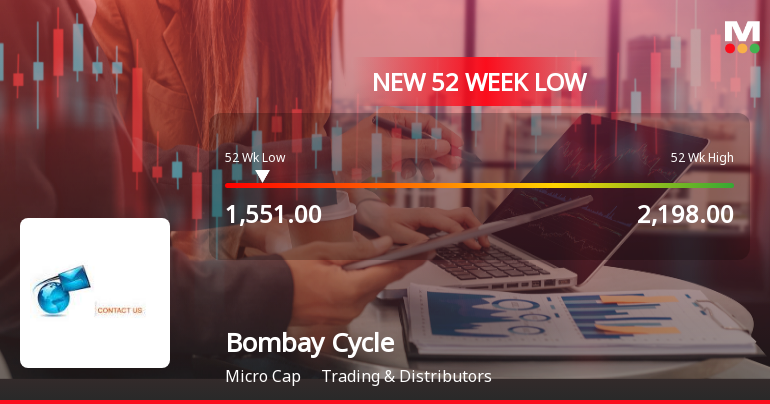

Bombay Cycle & Motor Agency Ltd is Rated Strong Sell
Bombay Cycle & Motor Agency Ltd is rated Strong Sell by MarketsMOJO. This rating was last updated on 04 Nov 2025. However, the analysis and financial metrics discussed below reflect the stock’s current position as of 17 June 2026, providing investors with an up-to-date view of the company’s fundamentals, valuation, financial trend, and technical outlook.
Read full news article Announcements
107Th Annual General Meeting On August 07 2026
01-Jul-2026 | Source : BSEPlease Find Attached herewith Intimation for 107th Annual General Meeting on August 07 2026.
Book Closure For The 107Th Annual General Meeting Of The Company
01-Jul-2026 | Source : BSEPlease Find Attached herewith Intimation for the Book Closure for the 107th Annual General Meeting of the Company.
Record Date For The Purpose Of Final Dividend For FY 25-26
01-Jul-2026 | Source : BSEPlease Find Attached herewith Intimation for the Record Date for the Purpose of Final Dividend For the FY 2025-2026.
Corporate Actions

No Upcoming Board Meetings

Bombay Cycle & Motor Agency Ltd has declared 50% dividend, ex-date: 24 Jul 26

No Splits history available

Bombay Cycle & Motor Agency Ltd has announced 1:1 bonus issue, ex-date: 13 Aug 19

No Rights history available
Quality key factors
Valuation key factors
Technicals key factors
 Technical Indicator Scale: Bearish, Mildly Bearish, Sideways, Mildly Bullish, Bullish Turned
 Shareholding Snapshot : Mar 2026
Shareholding Compare (%holding)
Promoters
None
Held by 0 Schemes
Held by 0 FIIs
Walchand Kamdhenu Commercials Private Limited (23.76%)
Rajan Malhotra (2.87%)
22.23%
Quarterly Results Snapshot (Consolidated) - Mar'26 - QoQ

QoQ Growth in quarter ended Mar 2026 is 18.84% vs 21.85% in Dec 2025
QoQ Growth in quarter ended Mar 2026 is 2.17% vs 560.00% in Dec 2025
Half Yearly Results Snapshot (Consolidated) - Sep'25
Growth in half year ended Sep 2025 is 5.03% vs 22.41% in Sep 2024
Growth in half year ended Sep 2025 is -29.95% vs 36.48% in Sep 2024
Nine Monthly Results Snapshot (Consolidated) - Dec'25
YoY Growth in nine months ended Dec 2025 is 8.41% vs 16.64% in Dec 2024

YoY Growth in nine months ended Dec 2025 is -10.00% vs -10.20% in Dec 2024
Annual Results Snapshot (Consolidated) - Mar'26
YoY Growth in year ended Mar 2026 is 19.77% vs 12.72% in Mar 2025
YoY Growth in year ended Mar 2026 is 178.96% vs -198.72% in Mar 2025
About Bombay Cycle & Motor Agency Ltd

Company Coordinates


