
Compare Geojit Fin. Ser. with Similar Stocks
Stock DNA
Capital Markets
INR 2,215 Cr (Small Cap)
25.00
21
1.90%
0.10
7.28%
1.83
Total Returns (Price + Dividend) 
Latest dividend: 1.5 per share ex-dividend date: Jul-11-2025
Risk Adjusted Returns v/s
Returns Beta

News

Geojit Financial Services Downgraded to Sell Amid Weak Financials and Mixed Technicals
Geojit Financial Services Ltd has been downgraded from a Hold to a Sell rating by MarketsMOJO as of 22 Jun 2026, reflecting a combination of deteriorating technical indicators, weakening financial trends, and valuation concerns despite some underlying quality strengths. The small-cap capital markets firm’s Mojo Score has declined to 40.0, signalling caution for investors amid recent negative quarterly results and subdued institutional interest.
Read full news article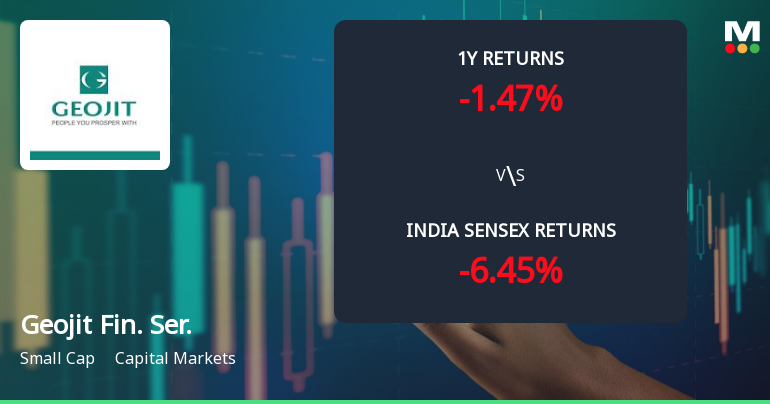
Geojit Financial Services Ltd Technical Momentum Shifts Amid Mixed Market Signals
Geojit Financial Services Ltd has experienced a notable shift in its technical momentum, moving from a mildly bullish stance to a sideways trend as of late June 2026. Despite a modest day gain of 0.54%, the stock’s technical indicators present a complex picture, with bullish signals on shorter timeframes contrasting with bearish cues on monthly charts. This nuanced technical landscape, combined with a recent downgrade in its Mojo Grade to Sell, warrants a detailed analysis for investors navigating the capital markets sector.
Read full news article
Geojit Financial Services Ltd Technical Momentum Shifts Signal Mild Bullish Outlook
Geojit Financial Services Ltd has exhibited a notable shift in its technical momentum, transitioning from a sideways trend to a mildly bullish stance. This change is underscored by mixed signals from key technical indicators such as MACD, RSI, Bollinger Bands, and moving averages, suggesting cautious optimism for investors in the capital markets sector.
Read full news article Announcements
Announcement under Regulation 30 (LODR)-Newspaper Publication
17-Jun-2026 | Source : BSEPlease find enclosed herein the newspaper publication dated 17.06.2026
Announcement under Regulation 30 (LODR)-Analyst / Investor Meet - Outcome
07-May-2026 | Source : BSEPlease find enclosed the transcript for earnings call held on 30.04.2026
Announcement under Regulation 30 (LODR)-Change in Management
04-May-2026 | Source : BSEPlease find enclosed the intimation regarding cessation of senior management personnel
Corporate Actions

No Upcoming Board Meetings

Geojit Financial Services Ltd has declared 150% dividend, ex-date: 10 Jul 26

Geojit Financial Services Ltd has announced 1:10 stock split, ex-date: 26 Sep 06

No Bonus history available

Geojit Financial Services Ltd has announced 1:6 rights issue, ex-date: 07 Oct 24
Quality key factors
Valuation key factors
Technicals key factors
 Technical Indicator Scale: Bearish, Mildly Bearish, Sideways, Mildly Bullish, Bullish Turned
 Shareholding Snapshot : Mar 2026
Shareholding Compare (%holding)
Non Institution
9.3112
Held by 1 Schemes (0.0%)
Held by 44 FIIs (1.87%)
C J George (19.53%)
Rekha Jhunjhunwala (7.2%)
36.36%
Quarterly Results Snapshot (Consolidated) - Mar'26 - QoQ

QoQ Growth in quarter ended Mar 2026 is 17.43% vs -5.71% in Dec 2025
QoQ Growth in quarter ended Mar 2026 is 38.49% vs -43.09% in Dec 2025
Half Yearly Results Snapshot (Consolidated) - Sep'25

Growth in half year ended Sep 2025 is -19.17% vs 57.43% in Sep 2024
Growth in half year ended Sep 2025 is -50.21% vs 75.22% in Sep 2024
Nine Monthly Results Snapshot (Consolidated) - Dec'25
YoY Growth in nine months ended Dec 2025 is -15.43% vs 40.69% in Dec 2024
YoY Growth in nine months ended Dec 2025 is -53.97% vs 44.69% in Dec 2024
Annual Results Snapshot (Consolidated) - Mar'26
YoY Growth in year ended Mar 2026 is -10.27% vs 21.78% in Mar 2025
YoY Growth in year ended Mar 2026 is -52.00% vs 15.66% in Mar 2025
About Geojit Financial Services Ltd

Company Coordinates


