
Compare Share India Sec. with Similar Stocks
Dashboard
Strong Long Term Fundamental Strength with an average Return on Equity (ROE) of 25.90%
Healthy long term growth as Operating profit has grown by an annual rate of 34.81%
Positive results in Mar 26
With ROE of 12.3, it has a Very Attractive valuation with a 1.5 Price to Book Value
42.87% of Promoter Shares are Pledged
Stock DNA
Capital Markets
INR 3,817 Cr (Small Cap)
12.00
NA
0.76%
0.26
12.28%
1.46
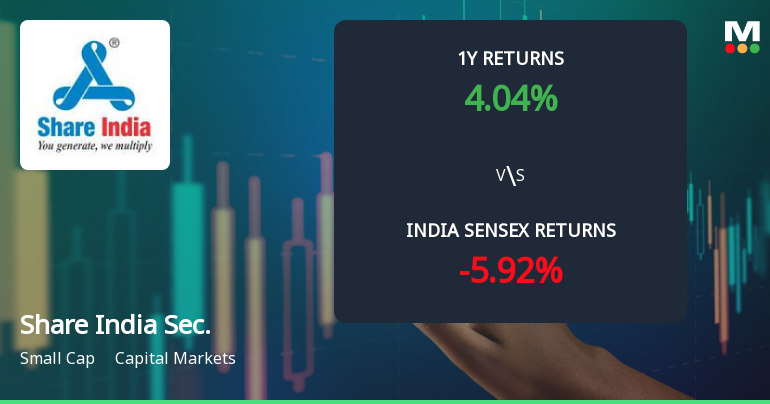
Total Returns (Price + Dividend) 
Latest dividend: 0.4011764705882353 per share ex-dividend date: Feb-02-2026
Risk Adjusted Returns v/s
Returns Beta

News
Share India Securities Ltd Technical Momentum Shifts Amid Mixed Market Signals
Share India Securities Ltd, a small-cap player in the capital markets sector, has experienced a notable shift in its technical momentum, moving from a mildly bullish stance to a sideways trend. Despite a slight dip in daily price, the stock’s mixed technical indicators reveal a complex interplay of bullish and bearish signals, prompting a reassessment of its near-term outlook.
Read full news article
Share India Securities Ltd is Rated Hold
Share India Securities Ltd is rated 'Hold' by MarketsMOJO, with this rating last updated on 06 July 2026. However, the analysis and financial metrics discussed here reflect the stock's current position as of 11 July 2026, providing investors with the most recent and relevant data to assess the company’s standing.
Read full news article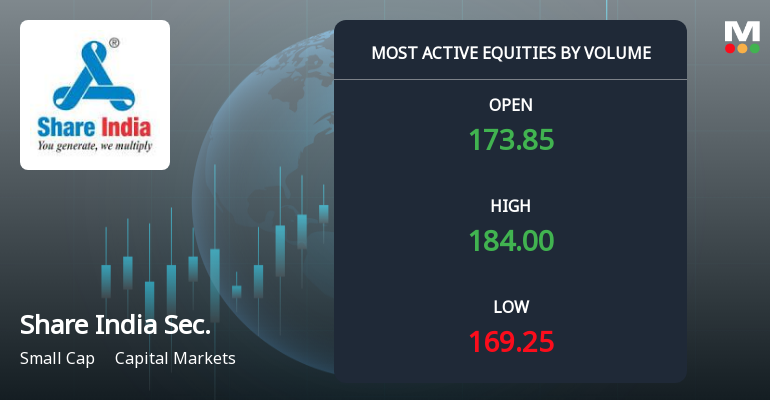
Share India Securities Ltd Sees Exceptional Volume Surge Amid Strong Price Gains
Share India Securities Ltd, a small-cap player in the Capital Markets sector, has witnessed a remarkable surge in trading volume accompanied by a notable price rally. The stock’s recent performance signals heightened investor interest and potential accumulation, marking it as one of the most actively traded equities in the market today.
Read full news article Announcements
Corporate Actions

No Upcoming Board Meetings

Share India Securities Ltd has declared 20% dividend, ex-date: 02 Feb 26

Share India Securities Ltd has announced 2:10 stock split, ex-date: 27 Jun 24

No Bonus history available

Share India Securities Ltd has announced 1:50 rights issue, ex-date: 28 Feb 23
Quality key factors
Valuation key factors
Technicals key factors
 Technical Indicator Scale: Bearish, Mildly Bearish, Sideways, Mildly Bullish, Bullish Turned
 Shareholding Snapshot : Mar 2026
Shareholding Compare (%holding)
Non Institution
42.8702
Held by 5 Schemes (0.1%)
Held by 44 FIIs (1.54%)
Rajesh Gupta (6.47%)
Arika Securities Private Limited (3.98%)
28.12%
Quarterly Results Snapshot (Consolidated) - Mar'26 - YoY

YoY Growth in quarter ended Mar 2026 is 73.70% vs -48.55% in Mar 2025
YoY Growth in quarter ended Mar 2026 is 208.26% vs -83.77% in Mar 2025
Half Yearly Results Snapshot (Consolidated) - Sep'25

Growth in half year ended Sep 2025 is -21.29% vs 34.68% in Sep 2024
Growth in half year ended Sep 2025 is -21.95% vs 16.47% in Sep 2024
Nine Monthly Results Snapshot (Consolidated) - Dec'25
YoY Growth in nine months ended Dec 2025 is -12.80% vs 18.84% in Dec 2024
YoY Growth in nine months ended Dec 2025 is -13.99% vs -0.32% in Dec 2024
Annual Results Snapshot (Consolidated) - Mar'26
YoY Growth in year ended Mar 2026 is 1.50% vs -2.31% in Mar 2025
YoY Growth in year ended Mar 2026 is -1.27% vs -22.99% in Mar 2025
About Share India Securities Ltd

Company Coordinates


