
Compare Canara Robeco with Similar Stocks
Stock DNA
Capital Markets
INR 5,196 Cr (Small Cap)
25.00
22
0.57%
0.00
27.39%
7.08
Total Returns (Price + Dividend) 
Latest dividend: 1.496299342105263 per share ex-dividend date: Dec-22-2025
Risk Adjusted Returns v/s
Returns Beta

News
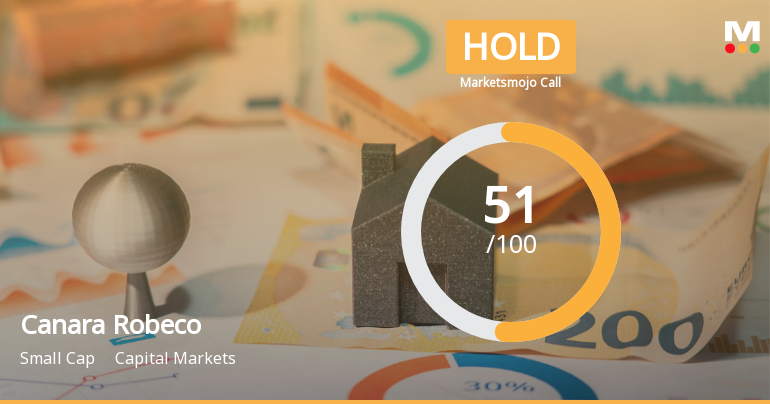
Canara Robeco Asset Management Upgraded to Hold on Technical Improvement and Valuation Concerns
Canara Robeco Asset Management Company Ltd has seen its investment rating upgraded from Sell to Hold, reflecting a nuanced shift in its technical outlook and valuation metrics despite flat financial performance in the latest quarter. The upgrade, effective from 14 July 2026, is driven primarily by improved technical indicators, balanced against valuation concerns and a cautious financial trend.
Read full news article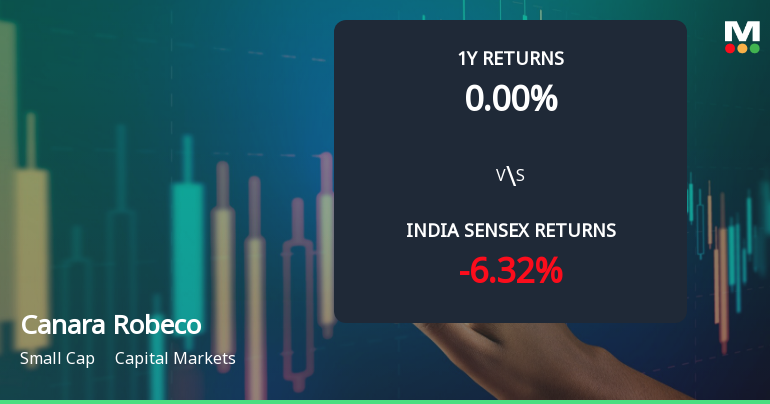
Canara Robeco Asset Management: Technical Momentum Shifts to Mildly Bullish Amid Mixed Returns
Canara Robeco Asset Management Company Ltd, a small-cap player in the capital markets sector, has recently exhibited a shift in its technical momentum from a sideways trend to a mildly bullish stance. Despite a flat day change at ₹265.00, the stock’s weekly and monthly technical indicators reveal a nuanced picture, suggesting cautious optimism for investors amid mixed signals from key momentum and trend-following tools.
Read full news article
Canara Robeco Asset Management: Technical Momentum Shifts Amid Mixed Market Returns
Canara Robeco Asset Management Company Ltd has experienced a notable shift in its technical momentum, moving from a mildly bearish stance to a sideways trend. Despite a recent 4.29% surge in its share price to ₹253.95, the stock continues to face headwinds from its broader year-to-date underperformance relative to the Sensex, prompting a downgrade in its Mojo Grade from Hold to Sell as of 22 June 2026.
Read full news article Announcements
Corporate Actions

21 Jul 2026

Canara Robeco Asset Management Company Ltd has declared 25% dividend, ex-date: 16 Jul 26

No Splits history available

No Bonus history available

No Rights history available
Quality key factors
Valuation key factors
Technicals key factors
 Technical Indicator Scale: Bearish, Mildly Bearish, Sideways, Mildly Bullish, Bullish Turned
 Shareholding Snapshot : Mar 2026
Shareholding Compare (%holding)
Promoters
None
Held by 14 Schemes (9.4%)
Held by 13 FIIs (1.72%)
Canara Bank (38.0%)
Nippon Life India Trustee Ltd-a/c Nippon India Small Cap Fund (2.49%)
10.7%
Quarterly Results Snapshot (Standalone) - Mar'26 - QoQ

QoQ Growth in quarter ended Mar 2026 is -14.58% vs 12.70% in Dec 2025
QoQ Growth in quarter ended Mar 2026 is -21.59% vs 8.29% in Dec 2025
Half Yearly Results Snapshot (Standalone) - Sep'25
Not Applicable: The company has declared_date for only one period
Not Applicable: The company has declared_date for only one period
Nine Monthly Results Snapshot (Standalone) - Dec'25
Not Applicable: The company has declared_date for only one period
Not Applicable: The company has declared_date for only one period
Annual Results Snapshot (Standalone) - Mar'26
YoY Growth in year ended Mar 2026 is 12.38% vs 26.91% in Mar 2025
YoY Growth in year ended Mar 2026 is 6.87% vs 26.29% in Mar 2025
About Canara Robeco Asset Management Company Ltd

Company Coordinates


