
Compare ICRA with Similar Stocks
Stock DNA
Capital Markets
INR 5,096 Cr (Small Cap)
27.00
34
1.14%
-0.64
15.79%
4.29
Total Returns (Price + Dividend) 
Latest dividend: 60 per share ex-dividend date: Jul-25-2025
Risk Adjusted Returns v/s
Returns Beta

News

ICRA Ltd is Rated Sell by MarketsMOJO
ICRA Ltd is rated Sell by MarketsMOJO, with this rating last updated on 18 Nov 2025. However, the analysis and financial metrics discussed here reflect the stock’s current position as of 11 July 2026, providing investors with an up-to-date view of the company’s fundamentals, valuation, financial trends, and technical outlook.
Read full news article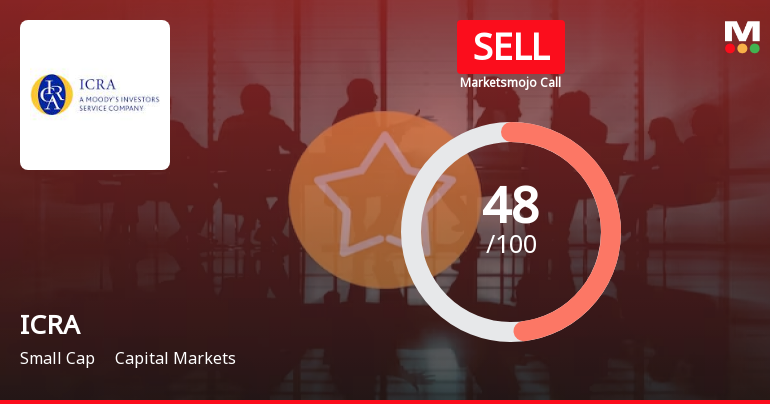
ICRA Ltd is Rated Sell by MarketsMOJO
ICRA Ltd is rated Sell by MarketsMOJO, with this rating last updated on 18 Nov 2025. However, the analysis and financial metrics discussed here reflect the company’s current position as of 30 June 2026, providing investors with an up-to-date perspective on the stock’s fundamentals, valuation, financial trends, and technical outlook.
Read full news article
ICRA Ltd is Rated Sell by MarketsMOJO
ICRA Ltd is rated Sell by MarketsMOJO, with this rating last updated on 18 Nov 2025. However, the analysis and financial metrics presented here reflect the stock's current position as of 19 June 2026, providing investors with an up-to-date view of the company’s fundamentals, valuation, financial trends, and technical outlook.
Read full news article Announcements
ICRA Limited - Analysts/Institutional Investor Meet/Con. Call Updates
27-Nov-2019 | Source : NSEICRA Limited has informed the Exchange regarding Analysts/Institutional Investor Meet/Con. Call Updates
ICRA Limited - Updates
22-Nov-2019 | Source : NSEICRA Limited has informed the Exchange regarding 'Disclosure of Related Party Transactions on consolidated basis for the six months ended September 30, 2019'.
Updates
20-Sep-2019 | Source : NSE
| ICRA Limited has informed the Exchange regarding 'Advertisement copies'. |
Corporate Actions

30 Jul 2026

ICRA Ltd has declared 700% dividend, ex-date: 23 Jul 26

No Splits history available

No Bonus history available

No Rights history available
Quality key factors
Valuation key factors
Technicals key factors
 Technical Indicator Scale: Bearish, Mildly Bearish, Sideways, Mildly Bullish, Bullish Turned
 Shareholding Snapshot : Jun 2026
Shareholding Compare (%holding)
Promoters
None
Held by 10 Schemes (20.48%)
Held by 73 FIIs (6.9%)
Moody's Investment Company India Private Limited (31.66%)
Nippon Life India Trustee Ltd-a/c Nippon India Small Cap Fund (8.39%)
11.64%
Quarterly Results Snapshot (Consolidated) - Mar'26 - QoQ

QoQ Growth in quarter ended Mar 2026 is 6.88% vs 19.78% in Dec 2025

QoQ Growth in quarter ended Mar 2026 is 35.11% vs -18.80% in Dec 2025
Half Yearly Results Snapshot (Consolidated) - Sep'25
Growth in half year ended Sep 2025 is 8.35% vs 16.08% in Sep 2024
Growth in half year ended Sep 2025 is 24.93% vs 0.22% in Sep 2024
Nine Monthly Results Snapshot (Consolidated) - Dec'25
YoY Growth in nine months ended Dec 2025 is 17.37% vs 12.31% in Dec 2024
YoY Growth in nine months ended Dec 2025 is 12.95% vs 9.63% in Dec 2024
Annual Results Snapshot (Consolidated) - Mar'26
YoY Growth in year ended Mar 2026 is 20.38% vs 11.64% in Mar 2025
YoY Growth in year ended Mar 2026 is 6.77% vs 12.52% in Mar 2025
About ICRA Ltd

Company Coordinates


