
Compare GRP with Similar Stocks
Dashboard
Low ability to service debt as the company has a high Debt to EBITDA ratio of 5.16 times
- Poor long term growth as Net Sales has grown by an annual rate of 13.86% over the last 5 years
- Low ability to service debt as the company has a high Debt to EBITDA ratio of 5.16 times
- The company has been able to generate a Return on Equity (avg) of 9.36% signifying low profitability per unit of shareholders funds
The company has declared negative results for the last 2 consecutive quarters
With ROCE of 5.8, it has a Expensive valuation with a 3.2 Enterprise value to Capital Employed
Despite the size of the company, domestic mutual funds hold only 0% of the company
Stock DNA
Industrial Products
INR 1,023 Cr (Micro Cap)
234.00
72
0.76%
1.08
2.43%
5.71
Total Returns (Price + Dividend) 
Latest dividend: 14.5 per share ex-dividend date: Jul-18-2025
Risk Adjusted Returns v/s
Returns Beta

News
GRP Ltd is Rated Strong Sell
GRP Ltd is rated Strong Sell by MarketsMOJO, with this rating last updated on 18 May 2026. However, the analysis and financial metrics presented here reflect the company’s current position as of 27 June 2026, providing investors with the latest insights into its performance and outlook.
Read full news article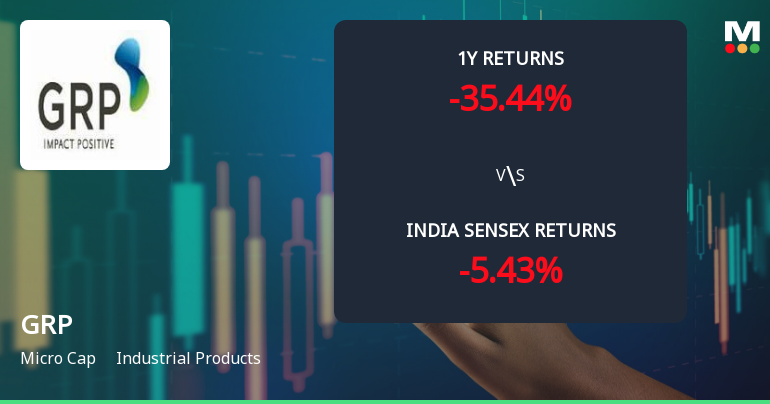
GRP Ltd Shares Surge Amid Mixed Technical Signals and Momentum Shift
GRP Ltd, a micro-cap player in the industrial products sector, has exhibited a notable shift in price momentum, with technical indicators signalling a complex interplay of bullish and bearish trends. Despite a strong day change of 9.60%, the company’s overall technical grade has been downgraded to a Strong Sell, reflecting caution amid mixed signals from MACD, RSI, and moving averages.
Read full news article
GRP Ltd is Rated Strong Sell
GRP Ltd is rated Strong Sell by MarketsMOJO, with this rating last updated on 18 May 2026. However, the analysis and financial metrics discussed here reflect the company’s current position as of 16 June 2026, providing investors with the latest insights into its performance and outlook.
Read full news article Announcements
Board Meeting Outcome for Outcome Of Board Meeting
17-Jun-2026 | Source : BSEOutcome of Board meeting
Announcement under Regulation 30 (LODR)-Analyst / Investor Meet - Intimation
22-May-2026 | Source : BSE360 One Capital Investor Group meet - 28.05.2026 10 am onwards
Announcement under Regulation 30 (LODR)-Earnings Call Transcript
22-May-2026 | Source : BSEAnnouncement under Regulation 30 (LODR) - Earnings Call Transcript - Earning call dt.18.05.2026
Corporate Actions

No Upcoming Board Meetings

GRP Ltd has declared 145% dividend, ex-date: 18 Jul 25

No Splits history available

GRP Ltd has announced 3:1 bonus issue, ex-date: 12 Aug 24

No Rights history available
Quality key factors
Valuation key factors
Technicals key factors
 Technical Indicator Scale: Bearish, Mildly Bearish, Sideways, Mildly Bullish, Bullish Turned
 Shareholding Snapshot : Mar 2026
Shareholding Compare (%holding)
Non Institution
None
Held by 1 Schemes (0.0%)
Held by 4 FIIs (0.05%)
Rajendra Vadilal Gandhi (4.87%)
Meera Philip (6.12%)
42.12%
Quarterly Results Snapshot (Consolidated) - Mar'26 - QoQ

QoQ Growth in quarter ended Mar 2026 is 7.28% vs 1.78% in Dec 2025

QoQ Growth in quarter ended Mar 2026 is -257.65% vs -56.63% in Dec 2025
Half Yearly Results Snapshot (Consolidated) - Sep'25
Growth in half year ended Sep 2025 is -0.68% vs 20.63% in Sep 2024
Growth in half year ended Sep 2025 is -46.00% vs 3.31% in Sep 2024
Nine Monthly Results Snapshot (Consolidated) - Dec'25
YoY Growth in nine months ended Dec 2025 is 0.18% vs 20.61% in Dec 2024
YoY Growth in nine months ended Dec 2025 is -59.47% vs 2.65% in Dec 2024
Annual Results Snapshot (Consolidated) - Mar'26
YoY Growth in year ended Mar 2026 is -2.75% vs 19.31% in Mar 2025
YoY Growth in year ended Mar 2026 is -89.51% vs 35.60% in Mar 2025
About GRP Ltd

Company Coordinates


