
Compare R S Software (I) with Similar Stocks
Dashboard
With a Operating Losses, the company has a Weak Long Term Fundamental Strength
- Company's ability to service its debt is weak with a poor EBIT to Interest (avg) ratio of -6.17
The company has declared negative results for the last 6 consecutive quarters
Risky - Negative EBITDA
Underperformed the market in the last 1 year
Stock DNA
Computers - Software & Consulting
INR 92 Cr (Micro Cap)
NA (Loss Making)
20
0.00%
0.31
-99.45%
2.99
Total Returns (Price + Dividend) 
Latest dividend: 0.25 per share ex-dividend date: Jul-19-2024
Risk Adjusted Returns v/s
Returns Beta

News

R S Software (India) Ltd Locks at Upper Circuit With 4.99% Gain — Buyers Queue, Sellers Absent
At Rs 36.61, the buying was done — not because demand dried up, but because the exchange wouldn't let the stock go any higher. R S Software (India) Ltd locked at its upper circuit of 4.99% on 18 Jun 2026, with buyers queuing and no sellers willing to part with shares.
Read full news article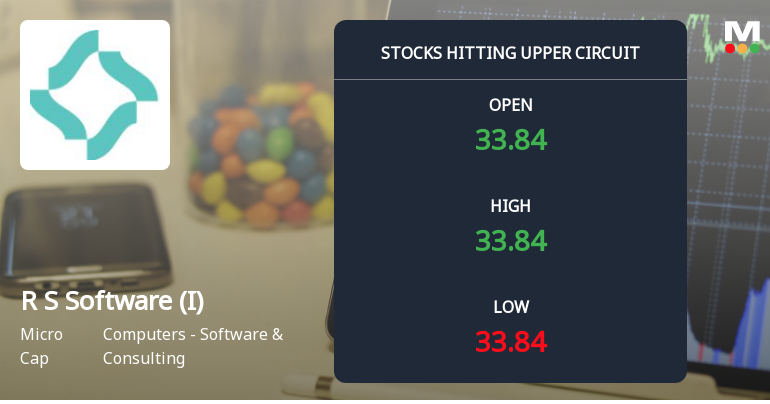
R S Software (India) Ltd Locks at Upper Circuit With 5% Gain — Buyers Queue, Sellers Absent
At Rs 34.87, the buying was done — not because demand dried up, but because the exchange wouldn't let the stock go any higher. R S Software (India) Ltd locked at its upper circuit of 5% on 18 Jun 2026, with buyers queuing and no sellers willing to part with shares.
Read full news article
R S Software (India) Ltd Locks at Upper Circuit With 5% Gain — Buyers Queue, Sellers Absent
At Rs 33.21, the buying was done — not because demand dried up, but because the exchange wouldn't let the stock go any higher. R S Software (India) Ltd locked at its upper circuit of 5% on 16 Jun 2026, with buyers queuing and no sellers willing to part with shares.
Read full news article Announcements
Intimation Of Book Closure And Annual General Meeting Of The Company For The Financial Year 2025-26.
17-Jun-2026 | Source : BSEIntimation of Book Closure and Annual General Meeting of the company for the financial year 2025-26.
Merger - Public Notice Dated 14Th May 2026 Received From The Companys Registrars & Share Transfer Agents (RTA)
18-May-2026 | Source : BSEMerger - Public Notice Dated 14th May 2026 received from the Companys Registrars & Share Transfer Agents (RTA).
Announcement under Regulation 30 (LODR)-Newspaper Publication
08-May-2026 | Source : BSEPaper Advertisements of the companys financial results for the period ending 31st March 2026 approved by the Board of Directors of the company at the Board Meeting held on 7th May 2026.
Corporate Actions

No Upcoming Board Meetings

R S Software (India) Ltd has declared 5% dividend, ex-date: 19 Jul 24

R S Software (India) Ltd has announced 5:10 stock split, ex-date: 21 Jan 15

R S Software (India) Ltd has announced 28:100 bonus issue, ex-date: 21 Jun 10

R S Software (India) Ltd has announced 1:2 rights issue, ex-date: 27 Sep 06
Quality key factors
Valuation key factors
Technicals key factors
 Technical Indicator Scale: Bearish, Mildly Bearish, Sideways, Mildly Bullish, Bullish Turned
 Shareholding Snapshot : Mar 2026
Shareholding Compare (%holding)
Non Institution
None
Held by 2 Schemes (0.01%)
Held by 3 FIIs (0.96%)
None
Bijal Pradip Desai (1.24%)
48.49%
Quarterly Results Snapshot (Consolidated) - Mar'26 - QoQ

QoQ Growth in quarter ended Mar 2026 is 11.21% vs -11.86% in Dec 2025
QoQ Growth in quarter ended Mar 2026 is -32.27% vs -42.40% in Dec 2025
Half Yearly Results Snapshot (Consolidated) - Sep'25

Growth in half year ended Sep 2025 is -61.51% vs 63.38% in Sep 2024
Growth in half year ended Sep 2025 is -199.37% vs 177.17% in Sep 2024
Nine Monthly Results Snapshot (Consolidated) - Dec'25
YoY Growth in nine months ended Dec 2025 is -60.55% vs 17.74% in Dec 2024
YoY Growth in nine months ended Dec 2025 is -260.50% vs -1.24% in Dec 2024
Annual Results Snapshot (Consolidated) - Mar'26
YoY Growth in year ended Mar 2026 is -56.14% vs -3.73% in Mar 2025
YoY Growth in year ended Mar 2026 is -433.45% vs -51.79% in Mar 2025
About R S Software (India) Ltd

Company Coordinates


