
Compare COSCO (India) with Similar Stocks
Dashboard
Weak Long Term Fundamental Strength with a -14.48% CAGR growth in Operating Profits over the last 5 years
- Low ability to service debt as the company has a high Debt to EBITDA ratio of 12.95 times
- The company has been able to generate a Return on Equity (avg) of 4.70% signifying low profitability per unit of shareholders funds
Underperformed the market in the last 1 year
Stock DNA
Diversified consumer products
INR 87 Cr (Micro Cap)
86.00
37
0.00%
1.28
2.02%
1.74
Total Returns (Price + Dividend) 
Latest dividend: 1.0000 per share ex-dividend date: Aug-20-2015
Risk Adjusted Returns v/s
Returns Beta

News
COSCO (India) Ltd Upgraded to 'Sell' as Technicals Improve Amid Mixed Financials
COSCO (India) Ltd has seen its investment rating upgraded from Strong Sell to Sell as of 12 June 2026, driven primarily by a shift in technical indicators despite ongoing fundamental challenges. The micro-cap stock, operating in the diversified consumer products sector, has exhibited a mild improvement in technical trends, prompting a reassessment of its near-term outlook. However, the company’s weak long-term financial metrics and underperformance relative to the broader market continue to weigh on its overall investment appeal.
Read full news article
COSCO (India) Ltd is Rated Strong Sell
COSCO (India) Ltd is rated Strong Sell by MarketsMOJO, with this rating last updated on 04 June 2026. However, the analysis and financial metrics discussed here reflect the stock’s current position as of 08 June 2026, providing investors with the latest insights into the company’s performance and outlook.
Read full news article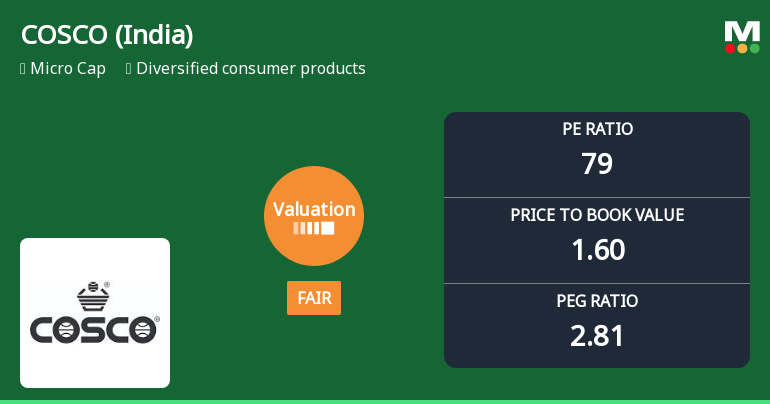
COSCO (India) Ltd Valuation Shifts Signal Changing Market Sentiment
COSCO (India) Ltd, a micro-cap player in the diversified consumer products sector, has experienced a notable shift in its valuation parameters, moving from an attractive to a fair rating. This change reflects evolving market perceptions amid subdued financial performance and heightened valuation multiples compared to peers and historical averages.
Read full news article Announcements
Announcement under Regulation 30 (LODR)-Newspaper Publication
01-Jun-2026 | Source : BSENewspaper Publication of Audited Financial Results for quarter and year ended 31.03.2026.
Audited Financial Results
30-May-2026 | Source : BSEAudited Financial Results for quarter and year ended 31.03.2026
Board Meeting Outcome for Audited Financial Results For Quarter And Year Ended 31.03.2026
30-May-2026 | Source : BSEOut Come of Board Meeting-Audited Financial Results for quarter and year ended 31.03.2026
Corporate Actions

No Upcoming Board Meetings

COSCO (India) Ltd has declared 10% dividend, ex-date: 20 Aug 15

No Splits history available

No Bonus history available

No Rights history available
Quality key factors
Valuation key factors
Technicals key factors
 Technical Indicator Scale: Bearish, Mildly Bearish, Sideways, Mildly Bullish, Bullish Turned
 Shareholding Snapshot : Mar 2026
Shareholding Compare (%holding)
Promoters
None
Held by 0 Schemes
Held by 0 FIIs
Navendu Investment Co.pvt.ltd. (35.42%)
Dugar Growth Fund Private Limited (3.6%)
18.31%
Quarterly Results Snapshot (Standalone) - Mar'26 - QoQ

QoQ Growth in quarter ended Mar 2026 is 8.81% vs 30.10% in Dec 2025
QoQ Growth in quarter ended Mar 2026 is 8.89% vs 162.94% in Dec 2025
Half Yearly Results Snapshot (Standalone) - Sep'25

Growth in half year ended Sep 2025 is 1.01% vs -0.29% in Sep 2024
Growth in half year ended Sep 2025 is -150.87% vs 44.17% in Sep 2024
Nine Monthly Results Snapshot (Standalone) - Dec'25
YoY Growth in nine months ended Dec 2025 is 6.69% vs -0.05% in Dec 2024
YoY Growth in nine months ended Dec 2025 is -99.04% vs -11.06% in Dec 2024
Annual Results Snapshot (Standalone) - Mar'26
YoY Growth in year ended Mar 2026 is 8.78% vs -1.82% in Mar 2025
YoY Growth in year ended Mar 2026 is 28.21% vs -75.70% in Mar 2025
About COSCO (India) Ltd

Company Coordinates


