
Compare AD Manum Finance with Similar Stocks
Stock DNA
Non Banking Financial Company (NBFC)
INR 47 Cr (Micro Cap)
4.00
21
0.00%
0.26
11.68%
0.51
Total Returns (Price + Dividend) 
Latest dividend: 1 per share ex-dividend date: Sep-22-2015
Risk Adjusted Returns v/s
Returns Beta

News

AD Manum Finance Ltd is Rated Sell
AD Manum Finance Ltd is rated 'Sell' by MarketsMOJO, with this rating last updated on 28 April 2026. However, the analysis and financial metrics discussed here reflect the stock's current position as of 18 June 2026, providing investors with an up-to-date view of the company’s fundamentals, valuation, financial trends, and technical outlook.
Read full news article
AD Manum Finance Ltd is Rated Sell
AD Manum Finance Ltd is rated 'Sell' by MarketsMOJO, with this rating last updated on 28 April 2026. However, the analysis and financial metrics discussed here reflect the stock's current position as of 08 June 2026, providing investors with an up-to-date view of the company’s fundamentals, valuation, financial trends, and technical outlook.
Read full news article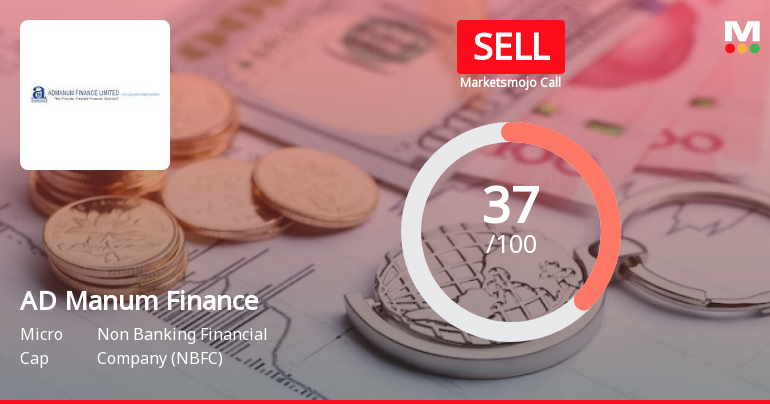
AD Manum Finance Ltd is Rated Sell
AD Manum Finance Ltd is rated 'Sell' by MarketsMOJO. This rating was last updated on 28 Apr 2026, reflecting a reassessment of the stock’s outlook. However, all fundamentals, returns, and financial metrics discussed here are current as of 25 May 2026, providing investors with the latest perspective on the company’s position.
Read full news article Announcements
Announcement under Regulation 30 (LODR)-Change in Management
10-Jun-2026 | Source : BSEThe Company has appointed Mr. Manish Chandan as the CFO and KMP of the Company w.e.f. June 10 2026
Board Meeting Outcome for Appointment Of Directors And CFO
10-Jun-2026 | Source : BSEThe Board of Directors in its meeting held on June 10 2026 has appointed Directors and CFO of the Company.
Announcement under Regulation 30 (LODR)-Change in Directorate
10-Jun-2026 | Source : BSEIntimation of Appointment of Directors of the Company w.e.f. June 10 2026
Corporate Actions

No Upcoming Board Meetings

AD Manum Finance Ltd has declared 10% dividend, ex-date: 22 Sep 15

No Splits history available

No Bonus history available

No Rights history available
Quality key factors
Valuation key factors
Technicals key factors
 Technical Indicator Scale: Bearish, Mildly Bearish, Sideways, Mildly Bullish, Bullish Turned
 Shareholding Snapshot : Mar 2026
Shareholding Compare (%holding)
Promoters
None
Held by 0 Schemes
Held by 0 FIIs
Agarwal Coal Corporation (s) Pte Ltd (36.93%)
Satya Prakash Mittal (huf) (1.46%)
20.46%
Quarterly Results Snapshot (Standalone) - Mar'26 - QoQ

QoQ Growth in quarter ended Mar 2026 is 34.02% vs 30.50% in Dec 2025
QoQ Growth in quarter ended Mar 2026 is 188.55% vs 9.17% in Dec 2025
Half Yearly Results Snapshot (Standalone) - Sep'25

Growth in half year ended Sep 2025 is -10.39% vs 58.09% in Sep 2024
Growth in half year ended Sep 2025 is 27.11% vs 102.30% in Sep 2024
Nine Monthly Results Snapshot (Standalone) - Dec'25
YoY Growth in nine months ended Dec 2025 is -8.40% vs 57.23% in Dec 2024
YoY Growth in nine months ended Dec 2025 is 2.07% vs 86.98% in Dec 2024
Annual Results Snapshot (Standalone) - Mar'26
YoY Growth in year ended Mar 2026 is 2.93% vs 20.58% in Mar 2025
YoY Growth in year ended Mar 2026 is 19.89% vs 15.58% in Mar 2025
About AD Manum Finance Ltd

Company Coordinates


