Cont. Securities

  • Market Cap: Micro Cap
  • Industry: Non Banking Financial Company (NBFC)
  • ISIN: INE183Q01020
  • NSEID:
  • BSEID: 538868
INR
21.21
-0.44 (-2.03%)
BSENSE

Sep 04, 03:30 PM

BSE+NSE Vol: 54.52 k

  • Price Points
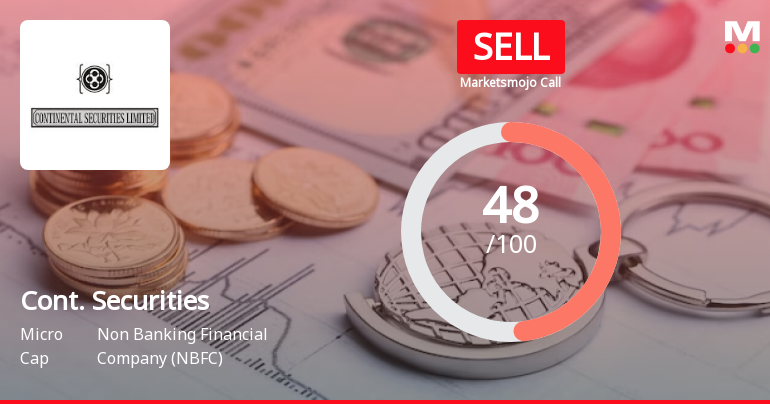
  • Score
  • Mojo Parameters
  • Total Return
  • News and Corporate Actions
  • Key factors
  • Shareholding
  • Financials
  • CompanyCV
stock-summaryPrice Point
High/Low

1Day

52 Week

Valuation
Technical
Day's Volume

CASH

54.52 k (-67.55%) Volume

Shareholding (Aug 2026)

FII

0.00%

Held by 0 FIIs

DII

0.00%

Held by 0 DIIs

Promoter

40.21%

Why is Continental Securities Ltd falling/rising?

04-Sep-2026

As of 03-Sep, Continental Securities Ltd's stock price is rising to 21.65, reflecting a 2.32% increase. The stock has shown strong performance with a 7.23% rise over the past week and 78.48% over the past month, outperforming the Sensex, and indicating a solid upward trend despite a decrease in investor participation.

As of 03-Sep, Continental Securities Ltd's stock price is rising, currently at 21.65, reflecting a change of 0.49 (2.32%) upward. The stock has demonstrated strong performance over various periods, with a notable increase of 7.23% over the past week, and an impressive 78.48% rise over the past month, significantly outperforming the Sensex, which has declined by 1.01% and 3.16% in the same respective periods.<BR><BR>Additionally, the stock has shown consistent gains, having risen for the last four days, accumulating a total return of 8.72% during this time. It is also trading above its moving averages across multiple time frames, including the 5-day, 20-day, 50-day, 100-day, and 200-day averages, indicating a strong upward trend.<BR><BR>Despite a decrease in investor participation, with delivery volume falling by 15.02% against the 5-day average, the stock remains liquid enough for trading, suggesting that the price increase is supported by solid underlying performance rather than speculative trading. Overall, the combination of strong returns, consistent upward movement, and favorable trading conditions contributes to the rising stock price of Continental Securities Ltd.

View full answer

Who are in the management team of Cont. Securities?

01-Sep-2026

The management team of Cont. Securities includes M L Khandelwal (Chairman), Rajesh Khuteta (Managing Director), and several Independent Non-Executive Directors: Vishnu Dusad, Suresh Kumar Gupta, Ruchi Gupta, Jagdish Chandra Kedawat, Annu Sharma Khandelwal, and Aayush Akar.

The management team of Cont. Securities includes the following members:<BR><BR>1. M L Khandelwal - Chairman & Independent Director<BR>2. Rajesh Khuteta - Executive Director & Managing Director<BR>3. Vishnu Dusad - Independent Non-Executive Director<BR>4. Suresh Kumar Gupta - Independent Non-Executive Director<BR>5. Ruchi Gupta - Independent Non-Executive Director<BR>6. Jagdish Chandra Kedawat - Independent Non-Executive Director<BR>7. Annu Sharma Khandelwal - Independent Non-Executive Director<BR>8. Aayush Akar - Independent Non-Executive Director<BR><BR>If you need more details about any specific member or their roles, feel free to ask!

View full answer

What does Cont. Securities do?

01-Sep-2026

Continental Securities Ltd is a Non Banking Financial Company (NBFC) focused on the micro-cap market, reporting net sales and profit of 1 Cr for June 2026, with a market cap of INR 64 Cr. Key metrics include a P/E of 27.00, a dividend yield of 0.18%, and a return on equity of 9.25%.

Overview: <BR>Continental Securities Ltd operates as a Non Banking Financial Company (NBFC) within the micro-cap market segment.<BR><BR>History: <BR>The company was originally incorporated in 1990 as "Home Land Finance & Consultants Private Limited" and later changed its name to "Continental Securities Private Limited" in 1995. The most recent quarterly results reported net sales and net profit of 1 Cr for June 2026.<BR><BR>Financial Snapshot: <BR>Most recent Net Sales: 1 Cr (Quarterly Results - Jun 2026) <BR>Most recent Net Profit: 1 Cr (Quarterly Results - Jun 2026) <BR>Market-cap value: INR 64 Cr (Micro Cap)<BR><BR>Key Metrics: <BR>P/E: 27.00 <BR>Industry P/E: 21 <BR>Dividend Yield: 0.18% <BR>Debt Equity: 0.01 <BR>Return on Equity: 9.25% <BR>Price to Book: 2.50 <BR><BR>Contact Details: <BR>Address: 301 Metro Plaza, Parivahan Marg Jaipur Rajasthan : 302001 <BR>Tel: 91-141-2377301 <BR>Email: continentalsecuritieslimited@gmail.com <BR>Website: http://www.continentalsecuritiesltd.com

View full answer

Who are the peers of the Cont. Securities?

01-Sep-2026

Peers of Cont. Securities include Oasis Securities, Minolta Finance, Odyssey Corpn., HB Portfolio, BAMPSL Sec., Everlon Fin., Dhruva Cap.Serv., Mantra Capital, and Dar Credit & Cap. Cont. Securities has a 1-year return of 14.91%, outperforming Odyssey Corpn. but underperforming Minolta Finance, which leads with 18.64%.

Peers: The peers of Cont. Securities are Oasis Securities, Minolta Finance, Odyssey Corpn., HB Portfolio, BAMPSL Sec., Everlon Fin., Dhruva Cap.Serv., Mantra Capital, and Dar Credit & Cap.<BR><BR>Quality Snapshot: Excellent management risk is observed at Oasis Securities, Minolta Finance, Odyssey Corpn., HB Portfolio, BAMPSL Sec., Cont. Securities, Dhruva Cap.Serv., Mantra Capital, and Dar Credit & Cap, while Average management risk is found at Everlon Fin. Below Average growth is noted at Oasis Securities, Odyssey Corpn., and HB Portfolio, while Excellent growth is seen at Minolta Finance, Cont. Securities, and Dhruva Cap.Serv. Good growth is present at BAMPSL Sec. and Dar Credit & Cap, with Average growth at Mantra Capital.<BR><BR>Return Snapshot: The peer with the highest 1-year return is Minolta Finance at 18.64%, while the lowest is Odyssey Corpn. at -23.08%. Cont. Securities has a 1-year return of 14.91%, which is higher than Odyssey Corpn. but lower than Minolta Finance. Additionally, peers with negative six-month returns include Dhruva Cap.Serv., Everlon Fin., and BAMPSL Sec.

View full answer

How big is Cont. Securities?

01-Sep-2026

As of 31st August, Continental Securities Ltd has a market capitalization of 64.00 Cr, with recent net sales of 4.22 Cr and a net profit of 2.40 Cr. Shareholder's funds are 17.31 Cr and total assets amount to 18.23 Cr as of March 2025.

As of 31st August, Continental Securities Ltd has a market capitalization of 64.00 Cr, categorizing it as a Micro Cap company.<BR><BR>In the latest four quarters, the company reported Net Sales of 4.22 Cr and a Net Profit of 2.40 Cr.<BR><BR>The latest annual period for the balance sheet is March 2025, with Shareholder's Funds amounting to 17.31 Cr and Total Assets of 18.23 Cr.

View full answer

Should I buy, sell or hold Continental Securities Ltd?

22-Aug-2026

Are Continental Securities Ltd latest results good or bad?

30-Jul-2026

Continental Securities Ltd's latest results show strong revenue and profit growth, with a net profit increase of 45.83% year-on-year. However, concerns about stock performance, low return on equity, and lack of institutional support suggest a mixed outlook overall.

Continental Securities Ltd's latest results present a mixed picture. On the positive side, the company reported a net profit of ₹0.70 crores for Q1 FY27, which is a significant increase of 45.83% year-on-year. Additionally, revenue grew by 29.67% compared to the same quarter last year, marking seven consecutive quarters of revenue growth. The operating margin stands at a robust 80.51%, and the profit after tax (PAT) margin is also strong at 59.32%.<BR><BR>However, despite these encouraging financial metrics, there are significant concerns. The company's stock is currently trading at ₹12.72, down 34.77% from its 52-week high of ₹19.50, indicating a bearish trend. Furthermore, the company's average return on equity (ROE) is only 7.93%, which is below the 15% threshold typically expected from quality financial services firms. The absence of institutional investors and a low Mojo Score of 26 out of 100 suggest a lack of confidence in the company's long-term prospects.<BR><BR>In summary, while the quarterly results show strong revenue and profit growth, the underlying challenges, including weak capital efficiency and technical weaknesses, indicate that the overall outlook may be concerning. Therefore, the results can be viewed as good in terms of growth but bad when considering the broader context of the company's financial health and market performance.

View full answer

When is the next results date for Continental Securities Ltd?

24-Jul-2026

The next results date for Continental Securities Ltd is 29 July 2026.

The next results date for Continental Securities Ltd is scheduled for 29 July 2026.

View full answer

Is Cont. Securities overvalued or undervalued?

29-Nov-2025

As of November 28, 2025, Cont. Securities is considered undervalued with a fair valuation grade, featuring a PE ratio of 23.32 and strong growth potential, especially when compared to peers like Bajaj Finance and Life Insurance, despite recent underperformance against the Sensex.

As of 28 November 2025, Cont. Securities has moved from a fair to an attractive valuation grade. The company is currently considered undervalued, particularly when compared to its peers. Key ratios include a PE ratio of 23.32, an EV to EBITDA of 16.45, and a PEG ratio of 0.56, indicating strong growth potential relative to its price.<BR><BR>In comparison to peers, Bajaj Finance is deemed very expensive with a PE ratio of 35.28, while Life Insurance stands out as very attractive with a PE of 11.07. This positions Cont. Securities favorably within its industry, especially given its lower valuation metrics. Notably, despite recent stock performance lagging behind the Sensex over the past year, the long-term returns of 556.94% over five years suggest a robust growth trajectory that may not yet be fully reflected in its current market price.

View full answer

How has been the historical performance of Cont. Securities?

15-Oct-2025

Cont. Securities has shown significant growth in net sales and profitability, with total operating income rising to 2.84 Cr in Mar'25 from 1.58 Cr in Mar'24, and profit after tax increasing to 1.33 Cr from 0.06 Cr in Mar'19. However, the company faces liquidity challenges, evidenced by negative net current assets and negative cash flow from operating activities.

Answer:<BR>The historical performance of Cont. Securities shows a significant upward trend in net sales and profitability over the years.<BR><BR>Breakdown:<BR>Cont. Securities has demonstrated strong growth in net sales, increasing from 0.41 Cr in Mar'19 to 2.75 Cr in Mar'25. Other operating income remained minimal until Mar'24, when it rose to 0.09 Cr. Total operating income also saw a substantial rise, reaching 2.84 Cr in Mar'25, up from 1.58 Cr in Mar'24. The company maintained low raw material costs and other operational expenses, resulting in an operating profit (PBDIT) of 1.87 Cr in Mar'25, significantly higher than 0.10 Cr in Mar'19. Profit before tax also increased to 1.81 Cr in Mar'25 from just 0.09 Cr in Mar'19, while profit after tax reached 1.33 Cr in Mar'25, up from 0.06 Cr in Mar'19. The company's total assets grew from 4.04 Cr in Mar'20 to 18.23 Cr in Mar'25, reflecting a robust increase in shareholder's funds and reserves. However, the company has consistently reported negative net current assets, indicating potential liquidity challenges. Cash flow from operating activities remained negative at -3.00 Cr in Mar'25, although cash flow from financing activities improved to 4.00 Cr, suggesting reliance on financing for operational needs. Overall, Cont. Securities has shown significant growth in revenue and profitability, despite facing liquidity issues.

View full answer

What is the technical trend for Cont. Securities?

09-Jun-2025

As of May 16, 2025, Cont. Securities shows a mildly bearish trend, with bearish weekly MACD and moving averages, while monthly indicators present mixed signals.

As of 16 May 2025, the technical trend for Cont. Securities has changed from bearish to mildly bearish. The weekly MACD remains bearish, while the monthly MACD is mildly bearish, indicating some weakness in momentum. The daily moving averages are also bearish, reinforcing the short-term negative outlook. The Bollinger Bands show a bearish stance on the weekly chart but are mildly bullish on the monthly, suggesting mixed signals across time frames. The KST indicates a bearish trend weekly but bullish monthly, adding to the complexity of the current stance. Overall, the technical stance is mildly bearish, with key indicators such as the MACD and moving averages driving this assessment.

View full answer

Who are the top shareholders of the Cont. Securities?

06-Jun-2025

The top shareholders of Cont. Securities are Vachi Commercial LLP with 7.43%, followed by public shareholder Prabha Gupta at 2.59%. Individual investors collectively own 42.99% of the shares, with no institutional holdings reported.

The top shareholders of Cont. Securities include Vachi Commercial LLP, which holds the highest promoter stake at 7.43%. The highest public shareholder is Prabha Gupta, with a holding of 2.59%. Additionally, individual investors collectively hold 42.99% of the company's shares. There are no institutional holdings from mutual funds or foreign institutional investors.

View full answer

Has Cont. Securities declared dividend?

06-Jun-2025

No Dividend History Available

iScoreScore
Click here to find our call on this stock
Strong Sell
Sell
Hold
Buy
Strong Buy

Dashboard

1

Weak Long Term Fundamental Strength with an average Return on Equity (ROE) of 7.93%

 
2

Flat results in Jun 26

 
stock-summaryMojo Parameters

Mojo Parameters

Loading Valuation Snapshot...

Stock DNA

stock-summary
Industry

Non Banking Financial Company (NBFC)

stock-summary
Market cap

INR 68 Cr (Micro Cap)

stock-summary
P/E

28.00

stock-summary
Industry P/E

20

stock-summary
Dividend Yield

0.17%

stock-summary
Debt Equity

0.01

stock-summary
Return on Equity

9.25%

stock-summary
Price to Book

2.65

Revenue and Profits:
Net Sales:
1 Cr
(Quarterly Results - Jun 2026)
Net Profit:
1 Cr
stock-summaryTotal Returns
Total Returns (Price + Dividend) stock-summary
Dividend Yield (0.17%)
TimePeriod
Price Return
Dividend Return
Total Return
3 Months
66.75%
0.29%
67.04%
6 Months
22.89%
0.25%
23.14%
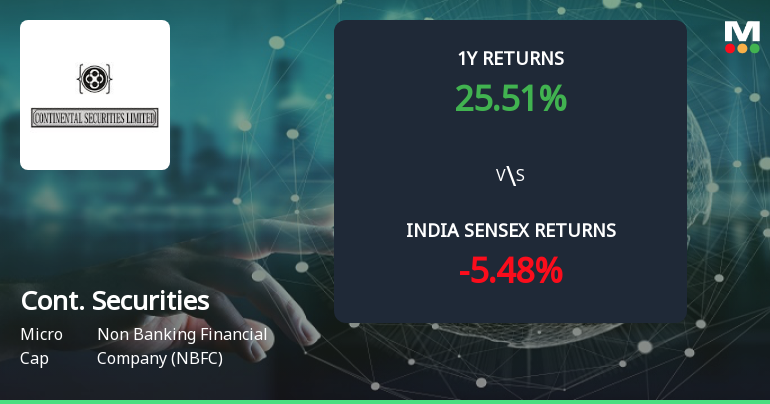
1 Year
24.69%
0.51%
25.2%
2 Years
129.3%
0.82%
130.12%
3 Years
258.28%
1.53%
259.81%
4 Years
131.3%
0.87%
132.17%
5 Years
473.24%
2.29%
475.53%

Latest dividend: 0.04 per share ex-dividend date: Sep-15-2025

Risk Adjusted Returns v/s stock-summary
Returns Beta
Icon
Beta has not been calculated since enough price history is not available
stock-summaryNews & Corporate Actions

Announcements stock-summary

Disclosure Under Regulation 30 Of SEBI (LODR) Regulations 2015 - Authorization Of Key Managerial Personnel To Determine Materiality Of Events Or Information

02-Sep-2026 | Source : BSE

Disclosure under Regulation 30 of SEBI (LODR) Regulations 2015 -Authorization of Key Managerial Personnel to determine Materiality of events or information

Disclosure Under Regulation 30 Of The SEBI (Listing Obligations And Disclosure Requirements) Regulation 2015.

02-Sep-2026 | Source : BSE

Please find enclosed the intimation letter sent to the shareholders holding shares in physical form regarding furnishing of their PAN/KYC Nomination and Bank Details as per the SEBI Mater Circular dated February 06 2026.

Disclosure Under Regulation 30 Of SEBI (Listing Obligations And Disclosure Requirements) Regulations 2015

02-Sep-2026 | Source : BSE

Please find enclosed a specimen of the reminder letter sent to those shareholders whose dividend remained unpaid/unclaimed and whose shares are liable to transferred IEPF Authority under section 124(6) of companiec act 2013.

Corporate Actions stock-summary

stock-summary
BOARD MEETING

No Upcoming Board Meetings

stock-summary
DIVIDEND

Continental Securities Ltd has declared 2% dividend, ex-date: 21 Sep 26

stock-summary
SPLITS

Continental Securities Ltd has announced 2:10 stock split, ex-date: 20 Mar 23

stock-summary
BONUS

No Bonus history available

stock-summary
RIGHTS

No Rights history available

stock-summaryKey Factors

Quality key factors stock-summary

Factor
Value
Sales Growth (5y)
33.94%
EBIT Growth (5y)
29.49%
Net Debt to Equity (avg)
0.01
Institutional Holding
0
ROE (avg)
7.93%

Valuation key factors

Factor
Value
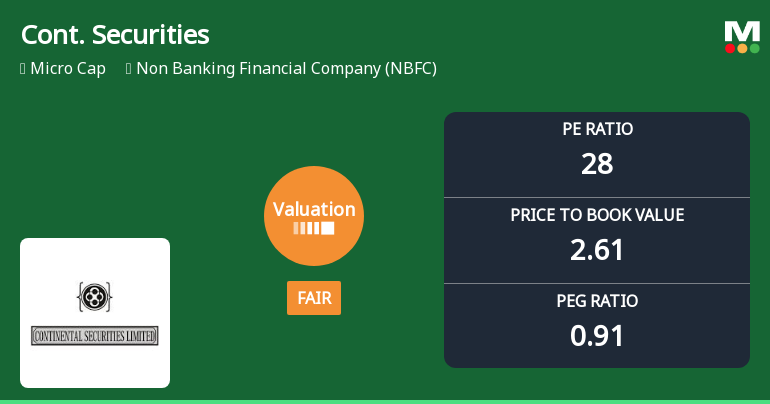
P/E Ratio
28
Industry P/E
20
Price to Book Value
2.60
EV to EBIT
20.96
EV to EBITDA
20.26
EV to Capital Employed
2.62
EV to Sales
15.89
PEG Ratio
0.90
Dividend Yield
0.17%
ROCE (Latest)
11.43%
ROE (Latest)
9.24%

Technicals key factors

Indicator
Weekly
Monthly
MACD
Bullish
Bullish
RSI
No Signal
No Signal
Bollinger Bands
Bullish
Sideways
Moving Averages
Bullish (Daily)
KST
Bullish
Mildly Bearish
Dow Theory
Mildly Bullish
No Trend
stock-summary Technical Indicator Scale: Bearish, Mildly Bearish, Sideways, Mildly Bullish, Bullish  Turned 
stock-summaryShareholding
Shareholding Snapshot : Aug 2026stock-summary
Shareholding Compare (%holding) stock-summary
Majority shareholders

Non Institution

Pledged Promoter Holdings

None

Mutual Funds

Held by 0 Schemes

FIIs

Held by 0 FIIs

Promoter with highest holding

Vachi Commercial Llp (12.44%)

Highest Public shareholder

Satiny Constructions Limited (3.15%)

Individual Investors Holdings

38.63%

stock-summaryFinancial
[
  {
    "link": "quarterly",
    "btn_text": "All Quarterly Results",
    "header": "Quarterly Results Snapshot (Standalone) - Jun'26 - YoY",
    "rhs": [
      {
        "prefix": "Net Sales ",
        "suffix": "YoY Growth in quarter ended Jun 2026 is 29.67% vs 40.00% in Jun 2025",
        "dir": -1
      },
      {
        "prefix": "Standalone Net Profit ",
        "suffix": "YoY Growth in quarter ended Jun 2026 is 45.83% vs 37.14% in Jun 2025",
        "dir": 1
      }
    ],
    "table": {
      "header": [
        "Jun'26",
        "Jun'25",
        "Change(%)"
      ],
      "body": [
        {
          "field": "Net Sales",
          "val1": "1.18",
          "val2": "0.91",
          "chgp": "29.67%",
          "chgp_class": "positive"
        },
        {
          "field": "Operating Profit (PBDIT) excl Other Income",
          "val1": "0.95",
          "val2": "0.69",
          "chgp": "37.68%",
          "chgp_class": "positive"
        },
        {
          "field": "Interest",
          "val1": "0.00",
          "val2": "0.01",
          "chgp": "-100.00%",
          "chgp_class": "positive"
        },
        {
          "field": "Exceptional Items",
          "val1": "0.00",
          "val2": "0.00",
          "chgp": "",
          "chgp_class": "neutral"
        },
        {
          "field": "Standalone Net Profit",
          "val1": "0.70",
          "val2": "0.48",
          "chgp": "45.83%",
          "chgp_class": "positive"
        },
        {
          "field": "Operating Profit Margin (Excl OI)",
          "val1": "80.51%",
          "val2": "75.82%",
          "chgp": "4.69%",
          "chgp_class": "positive"
        }
      ]
    }
  },
  {
    "link": "half-yearly",
    "btn_text": "All Half Yearly Results",
    "header": "Half Yearly Results Snapshot (Standalone) - Sep'25",
    "rhs": [
      {
        "prefix": "Net Sales ",
        "suffix": " Growth in half year ended Sep 2025 is 43.85% vs 71.05% in Sep 2024",
        "dir": -1
      },
      {
        "prefix": "Standalone Net Profit ",
        "suffix": " Growth in half year ended Sep 2025 is 43.06% vs 105.71% in Sep 2024",
        "dir": -1
      }
    ],
    "table": {
      "header": [
        "Sep'25",
        "Sep'24",
        "Change(%)"
      ],
      "body": [
        {
          "field": "Net Sales",
          "val1": "1.87",
          "val2": "1.30",
          "chgp": "43.85%",
          "chgp_class": "positive"
        },
        {
          "field": "Operating Profit (PBDIT) excl Other Income",
          "val1": "1.44",
          "val2": "0.98",
          "chgp": "46.94%",
          "chgp_class": "positive"
        },
        {
          "field": "Interest",
          "val1": "0.01",
          "val2": "0.01",
          "chgp": "",
          "chgp_class": "neutral"
        },
        {
          "field": "Exceptional Items",
          "val1": "0.00",
          "val2": "0.00",
          "chgp": "",
          "chgp_class": "neutral"
        },
        {
          "field": "Standalone Net Profit",
          "val1": "1.03",
          "val2": "0.72",
          "chgp": "43.06%",
          "chgp_class": "positive"
        },
        {
          "field": "Operating Profit Margin (Excl OI)",
          "val1": "77.01%",
          "val2": "75.38%",
          "chgp": "1.63%",
          "chgp_class": "positive"
        }
      ]
    }
  },
  {
    "link": "nine-monthly",
    "btn_text": "All Nine Monthly Results",
    "header": "Nine Monthly Results Snapshot (Standalone) - Dec'25",
    "rhs": [
      {
        "prefix": "Net Sales ",
        "suffix": "YoY Growth in nine months ended Dec 2025 is 43.28% vs 73.28% in Dec 2024",
        "dir": -1
      },
      {
        "prefix": "Standalone Net Profit ",
        "suffix": "YoY Growth in nine months ended Dec 2025 is 40.00% vs 105.36% in Dec 2024",
        "dir": -1
      }
    ],
    "table": {
      "header": [
        "Dec'25",
        "Dec'24",
        "Change(%)"
      ],
      "body": [
        {
          "field": "Net Sales",
          "val1": "2.88",
          "val2": "2.01",
          "chgp": "43.28%",
          "chgp_class": "positive"
        },
        {
          "field": "Operating Profit (PBDIT) excl Other Income",
          "val1": "2.22",
          "val2": "1.60",
          "chgp": "38.75%",
          "chgp_class": "positive"
        },
        {
          "field": "Interest",
          "val1": "0.02",
          "val2": "0.05",
          "chgp": "-60.00%",
          "chgp_class": "positive"
        },
        {
          "field": "Exceptional Items",
          "val1": "0.00",
          "val2": "0.00",
          "chgp": "",
          "chgp_class": "neutral"
        },
        {
          "field": "Standalone Net Profit",
          "val1": "1.61",
          "val2": "1.15",
          "chgp": "40.00%",
          "chgp_class": "positive"
        },
        {
          "field": "Operating Profit Margin (Excl OI)",
          "val1": "77.08%",
          "val2": "76.19%",
          "chgp": "0.89%",
          "chgp_class": "positive"
        }
      ]
    }
  },
  {
    "link": "annual",
    "btn_text": "All Annual Results",
    "header": "Annual Results Snapshot (Standalone) - Mar'26",
    "rhs": [
      {
        "prefix": "Net Sales ",
        "suffix": "YoY Growth in year ended Mar 2026 is 43.27% vs 74.05% in Mar 2025",
        "dir": -1
      },
      {
        "prefix": "Standalone Net Profit ",
        "suffix": "YoY Growth in year ended Mar 2026 is 64.66% vs 75.00% in Mar 2025",
        "dir": -1
      }
    ],
    "table": {
      "header": [
        "Mar'26",
        "Mar'25",
        "Change(%)"
      ],
      "body": [
        {
          "field": "Net Sales",
          "val1": "3.94",
          "val2": "2.75",
          "chgp": "43.27%",
          "chgp_class": "positive"
        },
        {
          "field": "Operating Profit (PBDIT) excl Other Income",
          "val1": "3.04",
          "val2": "1.87",
          "chgp": "62.57%",
          "chgp_class": "positive"
        },
        {
          "field": "Interest",
          "val1": "0.07",
          "val2": "0.05",
          "chgp": "40.00%",
          "chgp_class": "negative"
        },
        {
          "field": "Exceptional Items",
          "val1": "0.00",
          "val2": "0.00",
          "chgp": "",
          "chgp_class": "neutral"
        },
        {
          "field": "Standalone Net Profit",
          "val1": "2.19",
          "val2": "1.33",
          "chgp": "64.66%",
          "chgp_class": "positive"
        },
        {
          "field": "Operating Profit Margin (Excl OI)",
          "val1": "77.16%",
          "val2": "68.00%",
          "chgp": "9.16%",
          "chgp_class": "positive"
        }
      ]
    }
  }
]

Quarterly Results Snapshot (Standalone) - Jun'26 - YoYstock-summary

Jun'26
Jun'25
Change(%)
Net Sales
1.18
0.91
29.67%
Operating Profit (PBDIT) excl Other Income
0.95
0.69
37.68%
Interest
0.00
0.01
-100.00%
Exceptional Items
0.00
0.00
Standalone Net Profit
0.70
0.48
45.83%
Operating Profit Margin (Excl OI)
80.51%
75.82%
4.69%
Values in Rs Cr.
Direction Arrows
Net Sales

YoY Growth in quarter ended Jun 2026 is 29.67% vs 40.00% in Jun 2025

Direction Arrows
Standalone Net Profit

YoY Growth in quarter ended Jun 2026 is 45.83% vs 37.14% in Jun 2025

Half Yearly Results Snapshot (Standalone) - Sep'25stock-summary

Sep'25
Sep'24
Change(%)
Net Sales
1.87
1.30
43.85%
Operating Profit (PBDIT) excl Other Income
1.44
0.98
46.94%
Interest
0.01
0.01
Exceptional Items
0.00
0.00
Standalone Net Profit
1.03
0.72
43.06%
Operating Profit Margin (Excl OI)
77.01%
75.38%
1.63%
Values in Rs Cr.
Direction Arrows
Net Sales

Growth in half year ended Sep 2025 is 43.85% vs 71.05% in Sep 2024

Direction Arrows
Standalone Net Profit

Growth in half year ended Sep 2025 is 43.06% vs 105.71% in Sep 2024

Nine Monthly Results Snapshot (Standalone) - Dec'25stock-summary

Dec'25
Dec'24
Change(%)
Net Sales
2.88
2.01
43.28%
Operating Profit (PBDIT) excl Other Income
2.22
1.60
38.75%
Interest
0.02
0.05
-60.00%
Exceptional Items
0.00
0.00
Standalone Net Profit
1.61
1.15
40.00%
Operating Profit Margin (Excl OI)
77.08%
76.19%
0.89%
Values in Rs Cr.
Direction Arrows
Net Sales

YoY Growth in nine months ended Dec 2025 is 43.28% vs 73.28% in Dec 2024

Direction Arrows
Standalone Net Profit

YoY Growth in nine months ended Dec 2025 is 40.00% vs 105.36% in Dec 2024

Annual Results Snapshot (Standalone) - Mar'26stock-summary

Mar'26
Mar'25
Change(%)
Net Sales
3.94
2.75
43.27%
Operating Profit (PBDIT) excl Other Income
3.04
1.87
62.57%
Interest
0.07
0.05
40.00%
Exceptional Items
0.00
0.00
Standalone Net Profit
2.19
1.33
64.66%
Operating Profit Margin (Excl OI)
77.16%
68.00%
9.16%
Values in Rs Cr.
Direction Arrows
Net Sales

YoY Growth in year ended Mar 2026 is 43.27% vs 74.05% in Mar 2025

Direction Arrows
Standalone Net Profit

YoY Growth in year ended Mar 2026 is 64.66% vs 75.00% in Mar 2025

stock-summaryCompany CV
About Continental Securities Ltd stock-summary
stock-summary
Continental Securities Ltd
Micro Cap
Non Banking Financial Company (NBFC)
Continental Securities Limited was originally incorporated on March 30, 1990, as "Home Land Finance & Consultants Private Limited" with the Registrar of Companies, Rajasthan, Jaipur. Subsequently, the Company name was changed to "Continental Securities Private Limited" vide a fresh Certificate of Incorporation dated January 20, 1995 issued by the Registrar of Companies, Rajasthan, Jaipur.
Company Coordinates stock-summary
Company Details
301 Metro Plaza, Parivahan Marg Jaipur Rajasthan : 302001
stock-summary
Tel: 91-141-2377301
stock-summary
continentalsecuritieslimited@gmail.
Registrar Details
Beetal Financial & Computer Services (P) Ltd , Beetal House , 99 Mandangir, 3rd Floor, Behind Local Shopping Centre, Near Dada Harsukhdas Mandir, New Delhi