
Compare MOIL with Similar Stocks
Stock DNA
Minerals & Mining
INR 5,980 Cr (Small Cap)
22.00
11
2.33%
-0.37
9.90%
2.23
Total Returns (Price + Dividend) 
Latest dividend: 3.5000000000000004 per share ex-dividend date: Feb-05-2026
Risk Adjusted Returns v/s
Returns Beta

News
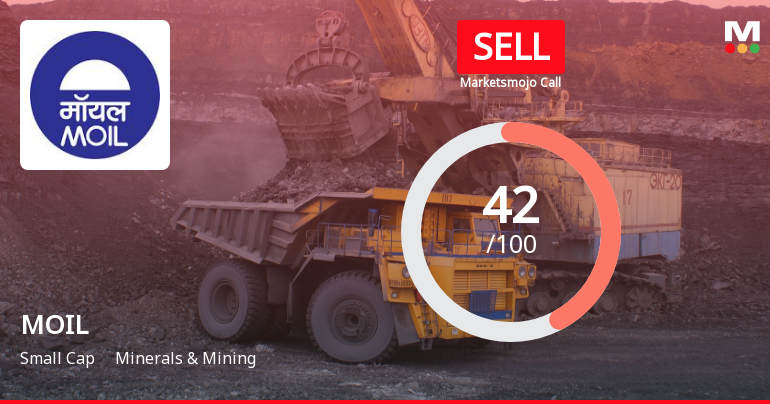
MOIL Ltd. is Rated Sell by MarketsMOJO
MOIL Ltd. is rated 'Sell' by MarketsMOJO, with this rating last updated on 10 April 2026. However, the analysis and financial metrics discussed here reflect the stock’s current position as of 19 June 2026, providing investors with an up-to-date view of the company’s fundamentals, valuation, financial trends, and technical outlook.
Read full news article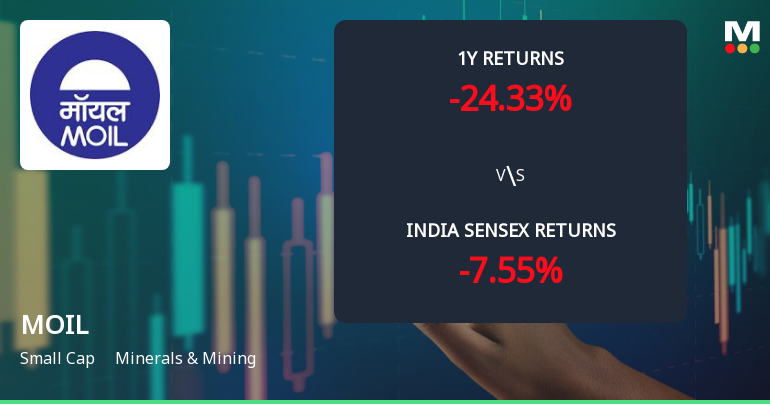
MOIL Ltd. Technical Momentum Shifts Amid Mixed Indicator Signals
MOIL Ltd., a small-cap player in the Minerals & Mining sector, has experienced a nuanced shift in its technical momentum, reflecting a complex interplay of bullish and bearish signals across key indicators. Despite a modest 3.11% rise in the latest session, the stock remains under pressure with a Mojo Grade of Sell, upgraded from Strong Sell on 10 Apr 2026, signalling cautious investor sentiment amid mixed technical trends.
Read full news article
MOIL Ltd. Technical Momentum Shifts Amid Bearish Signals and Market Underperformance
MOIL Ltd., a small-cap player in the Minerals & Mining sector, has experienced a notable shift in its technical momentum, with key indicators signalling a bearish trend. Despite a strong long-term return record, recent price action and technical parameters suggest caution for investors as the stock faces downward pressure amid broader market challenges.
Read full news article Announcements
Incorporation Of Joint Venture
06-Jun-2026 | Source : BSESubmission of incorporation of Joint Venture
Fixation Of Price Of Different Grades Of Manganese Ore
01-Jun-2026 | Source : BSESubmission of information relating to fixation of price of different grades of Manganese Ore.
Intimation Of Fine Imposed By Stock Exchanges.
28-May-2026 | Source : BSEIntimation of fine imposed by Stock Exchanges.
Corporate Actions

No Upcoming Board Meetings

MOIL Ltd. has declared 35% dividend, ex-date: 05 Feb 26

No Splits history available

MOIL Ltd. has announced 1:1 bonus issue, ex-date: 27 Sep 17

No Rights history available
Quality key factors
Valuation key factors
Technicals key factors
 Technical Indicator Scale: Bearish, Mildly Bearish, Sideways, Mildly Bullish, Bullish Turned
 Shareholding Snapshot : Mar 2026
Shareholding Compare (%holding)
Promoters
None
Held by 9 Schemes (2.44%)
Held by 99 FIIs (4.17%)
President Of India (53.35%)
Life Insurance Corporation Of India (3.47%)
19.79%
Quarterly Results Snapshot (Standalone) - Mar'26 - QoQ

QoQ Growth in quarter ended Mar 2026 is 27.90% vs -0.15% in Dec 2025
QoQ Growth in quarter ended Mar 2026 is 75.00% vs -24.87% in Dec 2025
Half Yearly Results Snapshot (Standalone) - Sep'25

Growth in half year ended Sep 2025 is -11.29% vs 7.91% in Sep 2024
Growth in half year ended Sep 2025 is -39.73% vs 36.61% in Sep 2024
Nine Monthly Results Snapshot (Standalone) - Dec'25
YoY Growth in nine months ended Dec 2025 is -9.37% vs 11.42% in Dec 2024
YoY Growth in nine months ended Dec 2025 is -34.26% vs 31.55% in Dec 2024
Annual Results Snapshot (Standalone) - Mar'26
YoY Growth in year ended Mar 2026 is -7.07% vs 9.35% in Mar 2025
YoY Growth in year ended Mar 2026 is -29.91% vs 30.10% in Mar 2025
About MOIL Ltd.

Company Coordinates


