
Compare Gravita India with Similar Stocks
Dashboard
Strong Long Term Fundamental Strength with an average Return on Equity (ROE) of 25.86%
- Healthy long term growth as Operating profit has grown by an annual rate 34.02%
- Strong ability to service debt as the company has a low Debt to EBITDA ratio of 1.69 times
Flat results in Mar 26
With ROE of 15.5, it has a Expensive valuation with a 5.4 Price to Book Value
Falling Participation by Institutional Investors
Stock DNA
Minerals & Mining
INR 13,103 Cr (Small Cap)
35.00
NA
0.00%
0.06
15.45%
5.38
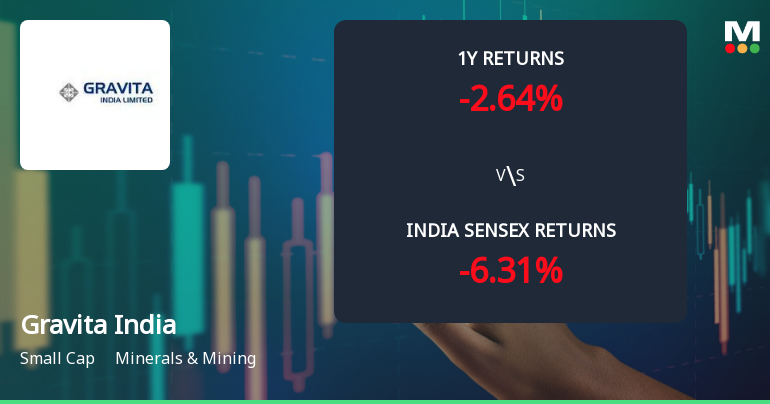
Total Returns (Price + Dividend) 
Latest dividend: 6.34 per share ex-dividend date: May-08-2025
Risk Adjusted Returns v/s
Returns Beta

News
Gravita India Ltd Technical Momentum Shifts Signal Bullish Outlook Amid Mixed Monthly Indicators
Gravita India Ltd has witnessed a notable shift in its technical momentum, with key indicators signalling a transition from mildly bullish to bullish on the weekly timeframe, despite mixed signals on the monthly charts. This nuanced technical landscape, combined with the company’s strong relative performance against the Sensex, offers investors a complex yet promising outlook in the minerals and mining sector.
Read full news article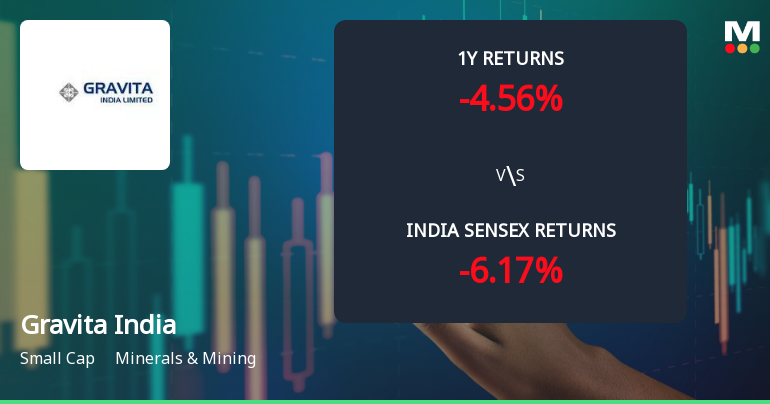
Gravita India Ltd Technical Momentum Shifts Amid Mixed Indicator Signals
Gravita India Ltd, a small-cap player in the Minerals & Mining sector, has experienced a nuanced shift in its technical momentum, moving from a bullish to a mildly bullish stance. Despite a 2.76% gain in the latest session, the stock’s technical indicators present a mixed picture, with some weekly signals remaining positive while monthly trends show caution. This article analyses the recent price momentum, key technical indicators, and the implications for investors amid evolving market dynamics.
Read full news article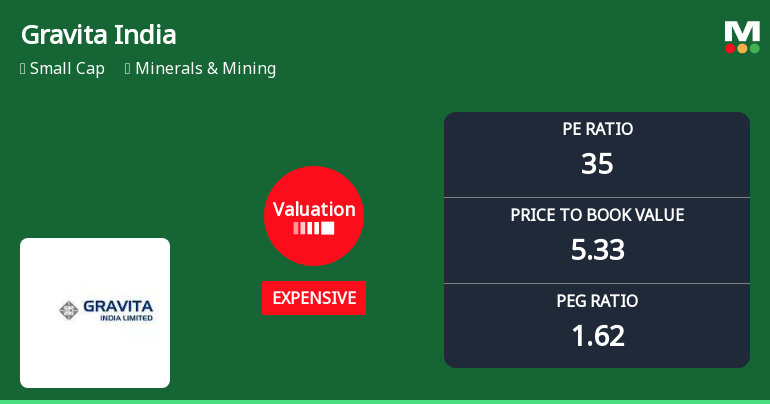
Gravita India Ltd Valuation Shifts Signal Changing Market Sentiment
Gravita India Ltd has witnessed a notable shift in its valuation parameters, moving from a fair to an expensive rating, reflecting evolving investor sentiment amid a robust performance backdrop. This change, accompanied by a recent downgrade in its Mojo Grade from Buy to Hold, invites a closer examination of its price-to-earnings and price-to-book value ratios relative to historical trends and peer benchmarks within the Minerals & Mining sector.
Read full news article Announcements
Gravita India Limited - Other General Purpose
15-Nov-2019 | Source : NSEGravita India Limited has informed the Exchange regarding disclosure of related party transactions pursuant to Regulation 23(9) of SEBI (LODR) Regulations, 2015.
Gravita India Limited - Updates
14-Nov-2019 | Source : NSEGravita India Limited has informed the Exchange regarding 'Pursuant to Regulation 47(3) of Securities and Exchange Board of India (Listing Obligations and Disclosure Requirements) Regulations, 2015 we enclose herewith copy of the Unaudited Financial Results published in newspapers as mentioned below:
Gravita India Limited - Press Release
13-Nov-2019 | Source : NSEGravita India Limited has informed the Exchange regarding a press release dated November 12, 2019, titled "Press Release for Unaudited Financial Results for the Quarter/ Half-year ended 30th September, 2019".
Corporate Actions

No Upcoming Board Meetings

Gravita India Ltd has declared 317% dividend, ex-date: 08 May 25

Gravita India Ltd has announced 2:10 stock split, ex-date: 25 May 12

No Bonus history available

No Rights history available
Quality key factors
Valuation key factors
Technicals key factors
 Technical Indicator Scale: Bearish, Mildly Bearish, Sideways, Mildly Bullish, Bullish Turned
 Shareholding Snapshot : Mar 2026
Shareholding Compare (%holding)
Promoters
None
Held by 21 Schemes (2.86%)
Held by 127 FIIs (13.94%)
Rajat Agrawal (32.38%)
Goldman Sachs Funds - Goldman Sachs India Equity P (2.23%)
18.16%
Quarterly Results Snapshot (Consolidated) - Mar'26 - QoQ

QoQ Growth in quarter ended Mar 2026 is 15.31% vs -1.78% in Dec 2025

QoQ Growth in quarter ended Mar 2026 is -5.93% vs 1.75% in Dec 2025
Half Yearly Results Snapshot (Consolidated) - Sep'25
Growth in half year ended Sep 2025 is 13.09% vs 19.21% in Sep 2024
Growth in half year ended Sep 2025 is 35.82% vs 26.74% in Sep 2024
Nine Monthly Results Snapshot (Consolidated) - Dec'25
YoY Growth in nine months ended Dec 2025 is 9.21% vs 23.26% in Dec 2024
YoY Growth in nine months ended Dec 2025 is 32.06% vs 27.65% in Dec 2024
Annual Results Snapshot (Consolidated) - Mar'26
YoY Growth in year ended Mar 2026 is 10.25% vs 22.40% in Mar 2025
YoY Growth in year ended Mar 2026 is 21.26% vs 30.60% in Mar 2025
About Gravita India Ltd

Company Coordinates


