
Compare Starteck Fin. with Similar Stocks
Stock DNA
Non Banking Financial Company (NBFC)
INR 272 Cr (Micro Cap)
11.00
21
0.07%
1.33
8.98%
1.03
Total Returns (Price + Dividend) 
Latest dividend: 0.20056214865708938 per share ex-dividend date: Aug-11-2025
Risk Adjusted Returns v/s
Returns Beta

News
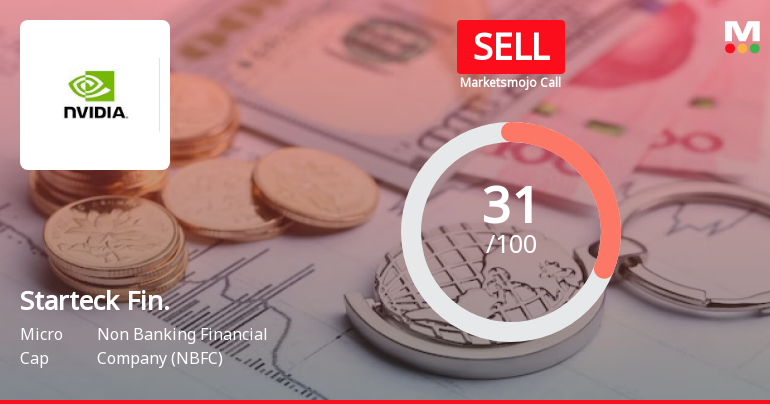
Starteck Finance Ltd is Rated Sell by MarketsMOJO
Starteck Finance Ltd is rated 'Sell' by MarketsMOJO, with this rating last updated on 25 May 2026. However, the analysis and financial metrics discussed here reflect the stock's current position as of 22 June 2026, providing investors with the latest insights into the company’s performance and outlook.
Read full news article
Starteck Finance Ltd is Rated Sell
Starteck Finance Ltd is rated Sell by MarketsMOJO, with this rating last updated on 25 May 2026. However, the analysis and financial metrics discussed here reflect the stock’s current position as of 11 June 2026, providing investors with an up-to-date view of the company’s fundamentals, valuation, financial trends, and technical outlook.
Read full news article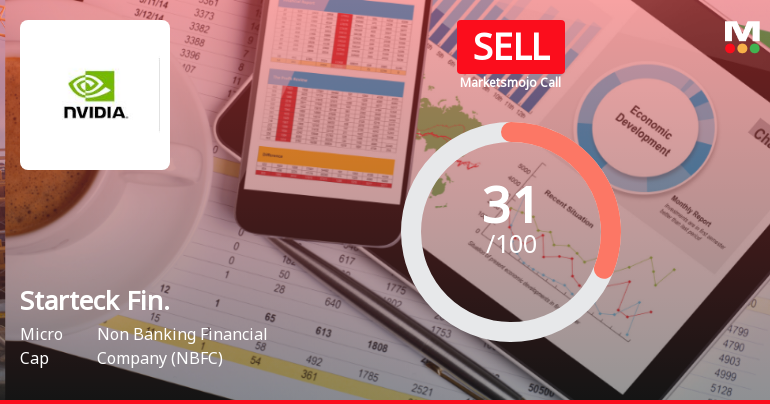
Starteck Finance Ltd Upgraded to Sell on Technical Improvements Despite Weak Fundamentals
Starteck Finance Ltd, a micro-cap player in the Non Banking Financial Company (NBFC) sector, has seen its investment rating upgraded from Strong Sell to Sell as of 25 May 2026. This change reflects a nuanced shift in the company’s technical outlook amid persistent fundamental challenges, prompting a reassessment of its valuation and financial trends.
Read full news article Announcements
Compliances-Reg.24(A)-Annual Secretarial Compliance
20-May-2026 | Source : BSEAnnual Secretarial Compliance Report for the Financial Year ended 31st March 2026
Audited Financial Results (Standalone And Consolidated) For The Quarter And Financial Year Ended 31St March 2026
13-May-2026 | Source : BSEAudited Financial Results (Standalone and Consolidated) for the quarter and financial year ended 31st March 2026
Board Meeting Outcome for Outcome Of Board Meeting
13-May-2026 | Source : BSEOutcome of Board Meeting
Corporate Actions

No Upcoming Board Meetings

Starteck Finance Ltd has declared 2% dividend, ex-date: 11 Aug 25

No Splits history available

No Bonus history available

No Rights history available
Quality key factors
Valuation key factors
Technicals key factors
 Technical Indicator Scale: Bearish, Mildly Bearish, Sideways, Mildly Bullish, Bullish Turned
 Shareholding Snapshot : Mar 2026
Shareholding Compare (%holding)
Promoters
None
Held by 0 Schemes
Held by 2 FIIs (0.0%)
Matrabhav Trust (kamal Khetan And Manisha Khetan) (11.69%)
Mount Overseas Private Limited (2.7%)
11.62%
Quarterly Results Snapshot (Consolidated) - Mar'26 - QoQ

QoQ Growth in quarter ended Mar 2026 is -18.37% vs 7.84% in Dec 2025
QoQ Growth in quarter ended Mar 2026 is -30.08% vs 1.63% in Dec 2025
Half Yearly Results Snapshot (Consolidated) - Sep'25

Growth in half year ended Sep 2025 is 11.71% vs -18.67% in Sep 2024
Growth in half year ended Sep 2025 is 105.66% vs -45.42% in Sep 2024
Nine Monthly Results Snapshot (Consolidated) - Dec'25
YoY Growth in nine months ended Dec 2025 is 13.34% vs -8.26% in Dec 2024
YoY Growth in nine months ended Dec 2025 is 105.82% vs -28.56% in Dec 2024
Annual Results Snapshot (Consolidated) - Mar'26
YoY Growth in year ended Mar 2026 is 9.32% vs -12.38% in Mar 2025
YoY Growth in year ended Mar 2026 is 126.58% vs -35.20% in Mar 2025
About Starteck Finance Ltd

Company Coordinates


