
Compare Syncom Formul. with Similar Stocks
Stock DNA
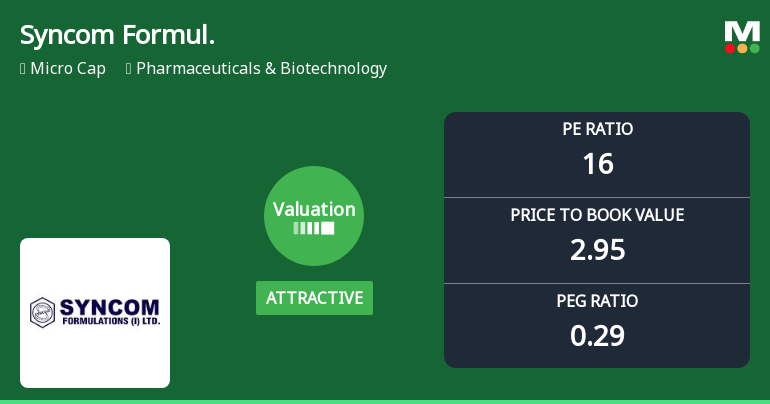
Pharmaceuticals & Biotechnology
INR 1,233 Cr (Micro Cap)
16.00
37
0.00%
-0.27
18.41%
2.95
Total Returns (Price + Dividend) 
Latest dividend: 0.03 per share ex-dividend date: Sep-09-2022
Risk Adjusted Returns v/s
Returns Beta

News
Syncom Formulations Valuation Shifts Signal Renewed Price Attractiveness Amid Sector Challenges
Syncom Formulations (India) Ltd has recently undergone a notable shift in its valuation parameters, moving from a fair to an attractive rating on key metrics such as price-to-earnings (P/E) and price-to-book value (P/BV). Despite a challenging year-to-date performance and a micro-cap status within the Pharmaceuticals & Biotechnology sector, the company’s improved valuation profile and robust return on capital employed (ROCE) suggest a potential opportunity for discerning investors.
Read full news article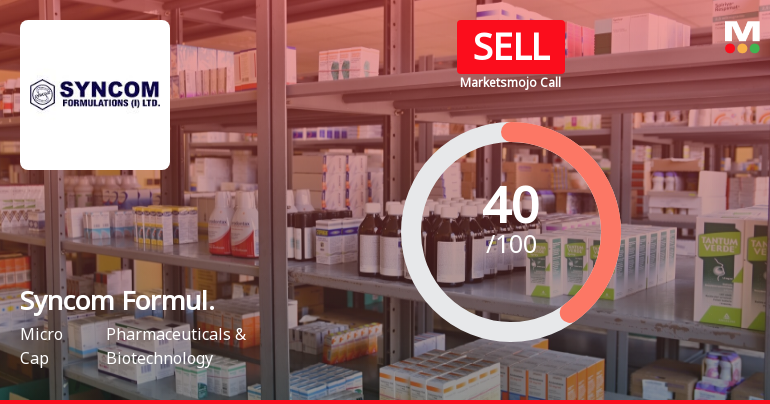
Syncom Formulations (India) Ltd is Rated Sell
Syncom Formulations (India) Ltd is rated 'Sell' by MarketsMOJO, with this rating last updated on 12 February 2026. However, the analysis and financial metrics discussed here reflect the company’s current position as of 25 July 2026, providing investors with an up-to-date view of the stock’s fundamentals, valuation, financial trend, and technical outlook.
Read full news article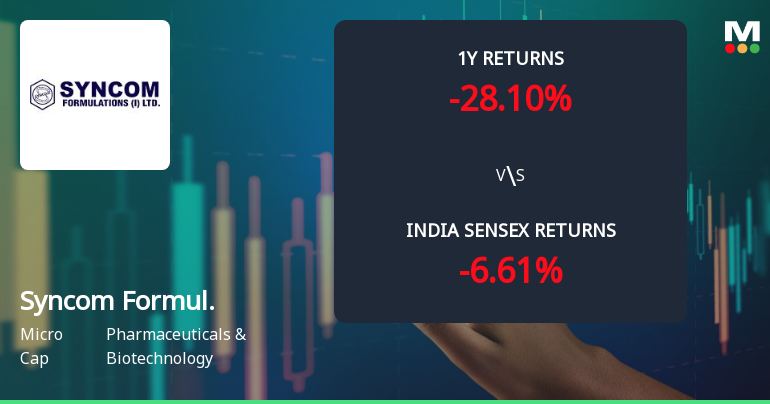
Syncom Formulations Faces Bearish Momentum Amid Technical Downgrade
Syncom Formulations (India) Ltd, a micro-cap player in the Pharmaceuticals & Biotechnology sector, has experienced a notable shift in its technical momentum, with key indicators signalling a bearish trend. The stock’s recent downgrade from a Hold to a Sell rating reflects growing concerns over its price momentum and technical health amid broader market pressures.
Read full news article Announcements
Compliances-Certificate under Reg. 74 (5) of SEBI (DP) Regulations 2018
10-Jul-2026 | Source : BSECertificate for compliance of regulation 74(5) of SEBI (Depositories and Participants) Regulation 2018 for the quarter ended 30th June 2026
Closure of Trading Window
25-Jun-2026 | Source : BSENotice for Trading window Closure for the financials of the quarter ended 30.06.2026
Announcement under Regulation 30 (LODR)-Newspaper Publication
23-May-2026 | Source : BSESubmission of Press Clipping related to extract of Audited Financial Results for the year ended 31.03.2026
Corporate Actions

No Upcoming Board Meetings

Syncom Formulations (India) Ltd has declared 3% dividend, ex-date: 09 Sep 22

Syncom Formulations (India) Ltd has announced 1:10 stock split, ex-date: 19 Aug 13

Syncom Formulations (India) Ltd has announced 5:2 bonus issue, ex-date: 19 Aug 13

Syncom Formulations (India) Ltd has announced 1:2 rights issue, ex-date: 13 May 09
Quality key factors
Valuation key factors
Technicals key factors
 Technical Indicator Scale: Bearish, Mildly Bearish, Sideways, Mildly Bullish, Bullish Turned
 Shareholding Snapshot : Jun 2026
Shareholding Compare (%holding)
Promoters
None
Held by 2 Schemes (0.0%)
Held by 15 FIIs (0.35%)
Kedarmal Shankarlal Bankda (12.44%)
None
44.9%
Quarterly Results Snapshot (Consolidated) - Mar'26 - QoQ

QoQ Growth in quarter ended Mar 2026 is 17.60% vs -5.41% in Dec 2025
QoQ Growth in quarter ended Mar 2026 is 33.10% vs 13.92% in Dec 2025
Half Yearly Results Snapshot (Consolidated) - Sep'25

Growth in half year ended Sep 2025 is 26.52% vs 52.50% in Sep 2024
Growth in half year ended Sep 2025 is 72.59% vs 71.86% in Sep 2024
Nine Monthly Results Snapshot (Consolidated) - Dec'25
YoY Growth in nine months ended Dec 2025 is 11.90% vs 67.43% in Dec 2024
YoY Growth in nine months ended Dec 2025 is 61.48% vs 77.28% in Dec 2024
Annual Results Snapshot (Consolidated) - Mar'26
YoY Growth in year ended Mar 2026 is 5.20% vs 76.55% in Mar 2025
YoY Growth in year ended Mar 2026 is 54.64% vs 95.30% in Mar 2025
About Syncom Formulations (India) Ltd

Company Coordinates


