
Compare ACS Tech with Similar Stocks
Dashboard
Poor Management Efficiency with a low ROCE of 7.50%
- The company has been able to generate a Return on Capital Employed (avg) of 7.50% signifying low profitability per unit of total capital (equity and debt)
Healthy long term growth as Net Sales has grown by an annual rate of 79.50% and Operating profit at 63.28%
With a growth in Net Sales of 80.55%, the company declared Very Positive results in Mar 26
With ROCE of 8.8, it has a Fair valuation with a 1.7 Enterprise value to Capital Employed
Majority shareholders : Non Institution
Market Beating Performance
Total Returns (Price + Dividend) 
ACS Tech for the last several years.
Risk Adjusted Returns v/s
Returns Beta

News
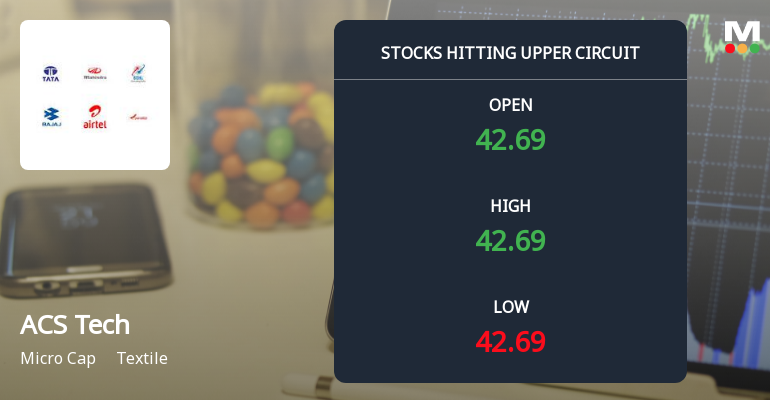
ACS Technologies Ltd Locks at Upper Circuit With 5% Gain — Buyers Queue, Sellers Absent
At Rs 42.7, the buying was done — not because demand dried up, but because the exchange wouldn't let the stock go any higher. ACS Technologies Ltd locked at its upper circuit of 4.99% on 24 Jun 2026, with buyers queuing and no sellers willing to part with shares.
Read full news article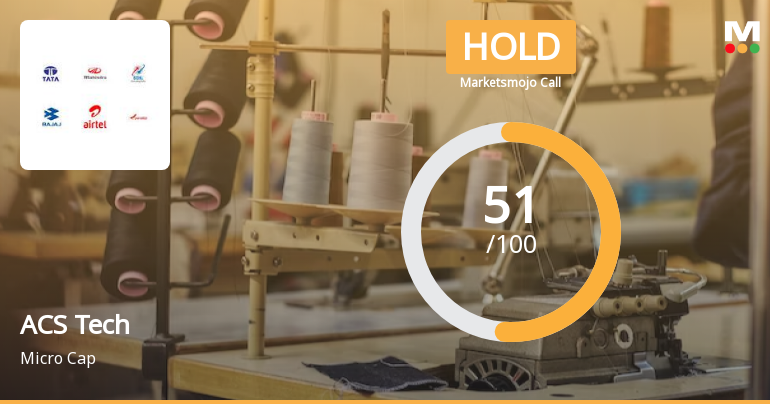
ACS Technologies Ltd is Rated Hold
ACS Technologies Ltd is rated 'Hold' by MarketsMOJO, with this rating last updated on 25 May 2026. However, the analysis and financial metrics discussed below reflect the stock's current position as of 23 June 2026, providing investors with an up-to-date view of the company’s performance and outlook.
Read full news article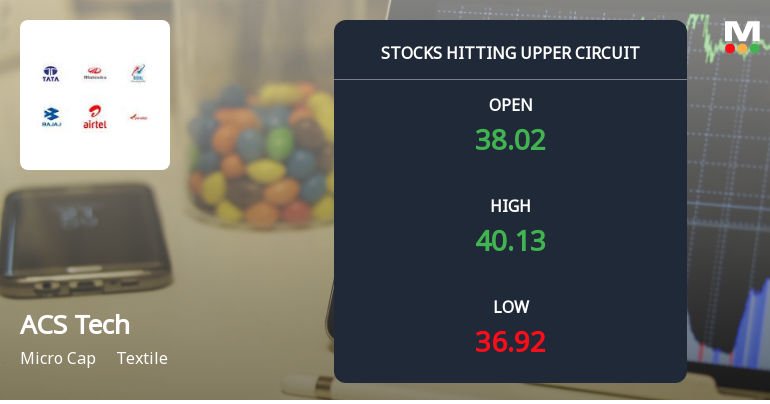
ACS Technologies Ltd Locks at Upper Circuit With 5% Gain — Buyers Queue, Sellers Absent
At Rs 39.98, the buying was done — not because demand dried up, but because the exchange wouldn't let the stock go any higher. ACS Technologies Ltd locked at its upper circuit of 4.99% on 22 Jun 2026, with buyers queuing and no sellers willing to part with shares.
Read full news article Announcements
Announcement under Regulation 30 (LODR)-Press Release / Media Release
19-Jun-2026 | Source : BSEAnnouncement under Regulation 30 (LODR)- Press release
Announcement under Regulation 30 (LODR)-Analyst / Investor Meet - Intimation
17-Jun-2026 | Source : BSEAnnouncement Under Regulation 30 - (LODR)- Analyst/ Investor Meet
Submission Of NIL Statement Of Deviation Or Variation In Utilization Of Funds Raised.
29-May-2026 | Source : BSESubmission of NIL Statement of deviation or variation in utilization of funds raised.
Corporate Actions

No Upcoming Board Meetings

No Dividend history available

No Splits history available

No Bonus history available

No Rights history available
Quality key factors
Valuation key factors
Technicals key factors
 Technical Indicator Scale: Bearish, Mildly Bearish, Sideways, Mildly Bullish, Bullish Turned
 Shareholding Snapshot : Mar 2026
Shareholding Compare (%holding)
Non Institution
None
Held by 0 Schemes
Held by 0 FIIs
Alokam Prabhakara Rao (13.95%)
Nexta Enterprises Llp (3.29%)
41.0%
Quarterly Results Snapshot (Consolidated) - Mar'26 - QoQ

QoQ Growth in quarter ended Mar 2026 is 80.55% vs 39.15% in Dec 2025

QoQ Growth in quarter ended Mar 2026 is -23.59% vs 29.68% in Dec 2025
Half Yearly Results Snapshot (Standalone) - Sep'25
Not Applicable: The company has declared_date for only one period
Not Applicable: The company has declared_date for only one period
Nine Monthly Results Snapshot (Standalone) - Dec'25
Not Applicable: The company has declared_date for only one period
Not Applicable: The company has declared_date for only one period
Annual Results Snapshot (Consolidated) - Mar'26
YoY Growth in year ended Mar 2026 is 108.75% vs 54.38% in Mar 2025
YoY Growth in year ended Mar 2026 is 69.00% vs 11.35% in Mar 2025
About ACS Technologies Ltd

Company Coordinates


