
Compare Swan Corp with Similar Stocks
Dashboard
With a Operating Losses, the company has a Weak Long Term Fundamental Strength
- Low ability to service debt as the company has a high Debt to EBITDA ratio of -10.32 times
- The company has been able to generate a Return on Equity (avg) of 3.75% signifying low profitability per unit of shareholders funds
The company has declared Negative results for the last 3 consecutive quarters
Risky - Negative EBITDA
36.89% of Promoter Shares are Pledged
Below par performance in long term as well as near term
Total Returns (Price + Dividend) 
Latest dividend: 0.1 per share ex-dividend date: Sep-22-2025
Risk Adjusted Returns v/s
Returns Beta

News
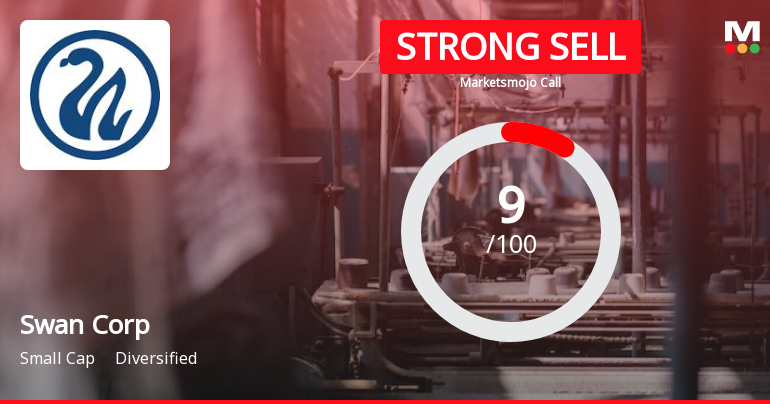
Swan Corp Ltd is Rated Strong Sell
Swan Corp Ltd is rated Strong Sell by MarketsMOJO, with this rating last updated on 17 Nov 2025. However, the analysis and financial metrics discussed here reflect the company’s current position as of 19 June 2026, providing investors with the latest insights into its performance and outlook.
Read full news article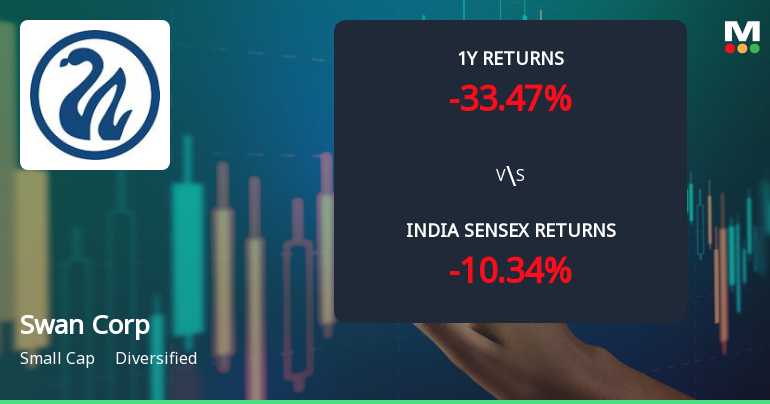
Swan Corp Ltd Technical Momentum Shifts Amid Bearish Sentiment
Swan Corp Ltd, a diversified small-cap company, has experienced a nuanced shift in its technical momentum, reflecting a complex interplay of bearish and mildly bullish signals across multiple timeframes. Despite a modest daily price increase of 1.67%, the stock remains under pressure with a strong sell rating and a significant underperformance relative to the Sensex over the past year.
Read full news article
Swan Corp Ltd is Rated Strong Sell
Swan Corp Ltd is rated Strong Sell by MarketsMOJO, with this rating last updated on 17 Nov 2025. However, the analysis and financial metrics discussed here reflect the company’s current position as of 08 June 2026, providing investors with the latest insights into its performance and outlook.
Read full news article Announcements
Announcement under Regulation 30 (LODR)-Newspaper Publication
30-May-2026 | Source : BSECopy of Newspaper Publication for Audited Financial Results for the quarter and year ended 31st March 2026.
Corporate Action-Board approves Dividend
29-May-2026 | Source : BSEBoard of Directors at its Meeting held on 29th May 2026 has recommended a dividend of Re. 0.15 per Equity Share of Re. 1 each fully paid up (i.e. 15%) for the F.Y. 2025-26.
Financial Results For The Quarter And Year Ended 31/03/2026.
29-May-2026 | Source : BSEFinancial Results for the quarter and year ended 31/03/2026
Corporate Actions

No Upcoming Board Meetings

Swan Corp Ltd has declared 10% dividend, ex-date: 22 Sep 25

Swan Corp Ltd has announced 1:2 stock split, ex-date: 03 Feb 14

No Bonus history available

No Rights history available
Quality key factors
Valuation key factors
Technicals key factors
 Technical Indicator Scale: Bearish, Mildly Bearish, Sideways, Mildly Bullish, Bullish Turned
 Shareholding Snapshot : Mar 2026
Shareholding Compare (%holding)
Promoters
36.8854
Held by 49 Schemes (4.96%)
Held by 108 FIIs (10.42%)
Dave Impex Private Limited (14.68%)
Life Insurance Corporation Of India (5.35%)
14.55%
Quarterly Results Snapshot (Consolidated) - Mar'26 - YoY

YoY Growth in quarter ended Mar 2026 is 1.62% vs -38.78% in Mar 2025
YoY Growth in quarter ended Mar 2026 is 1,615.40% vs -166.68% in Mar 2025
Half Yearly Results Snapshot (Consolidated) - Sep'25
Growth in half year ended Sep 2025 is 8.17% vs 7.22% in Sep 2024

Growth in half year ended Sep 2025 is -91.95% vs 19.28% in Sep 2024
Nine Monthly Results Snapshot (Consolidated) - Dec'25
YoY Growth in nine months ended Dec 2025 is -14.22% vs 12.79% in Dec 2024
YoY Growth in nine months ended Dec 2025 is -99.29% vs 181.53% in Dec 2024
Annual Results Snapshot (Consolidated) - Mar'26
YoY Growth in year ended Mar 2026 is -11.48% vs -1.58% in Mar 2025
YoY Growth in year ended Mar 2026 is -63.71% vs 150.79% in Mar 2025
About Swan Corp Ltd

Company Coordinates


