
Compare Godfrey Phillips with Similar Stocks
Dashboard
Strong Long Term Fundamental Strength with an average Return on Equity (ROE) of 20.35%
- Healthy long term growth as Net Sales has grown by an annual rate of 20.41% and Operating profit at 29.62%
- Company has a Debt to Equity ratio (avg) of 0.02 times
Positive results in Mar 26
With ROE of 24.6, it has a Fair valuation with a 5.7 Price to Book Value
Falling Participation by Institutional Investors
Underperformed the market in the last 1 year
Total Returns (Price + Dividend) 
Latest dividend: 17 per share ex-dividend date: Nov-10-2025
Risk Adjusted Returns v/s
Returns Beta

News

Godfrey Phillips India Ltd. is Rated Hold
Godfrey Phillips India Ltd. is rated 'Hold' by MarketsMOJO, with this rating last updated on 13 April 2026. However, the analysis and financial metrics discussed here reflect the stock's current position as of 19 June 2026, providing investors with the latest insights into its performance and outlook.
Read full news article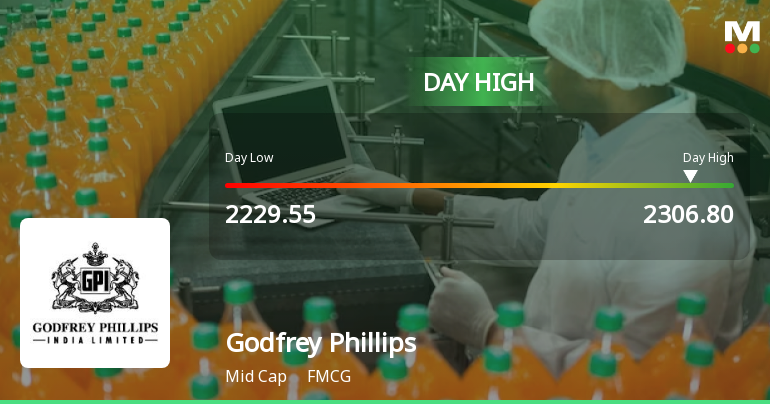
Godfrey Phillips India Ltd. Rallies 5.18% and Approaches 200 DMA Resistance — A Key Technical Test Ahead
The Sensex climbed 2.27% on 12 Jun 2026, yet Godfrey Phillips India Ltd. surged 5.18%, outperforming its FMCG sector by 3.8 percentage points. This strong single-session gain rewrites the short-term narrative for the mid-cap stock, which has now approached a critical resistance level near its 200-day moving average.
Read full news article
Godfrey Phillips India Ltd. is Rated Hold
Godfrey Phillips India Ltd. is rated 'Hold' by MarketsMOJO, with this rating last updated on 13 April 2026. However, all fundamentals, returns, and financial metrics discussed here reflect the stock's current position as of 08 June 2026, providing investors with the most up-to-date analysis.
Read full news article Announcements
Announcement under Regulation 30 (LODR)-Newspaper Publication
17-Jun-2026 | Source : BSENewspaper publication regarding loss of share certificates.
Intimation Under Regulation 30 - Contract Manufacturing Agreement
27-May-2026 | Source : BSEIntimation under Regulation 30 - Contract Manufacturing Agreement
Compliances-Reg.24(A)-Annual Secretarial Compliance
21-May-2026 | Source : BSEAnnual Secretarial Compliance Report for the Financial Year ended 31st March 2026.
Corporate Actions

No Upcoming Board Meetings

Godfrey Phillips India Ltd. has declared 850% dividend, ex-date: 10 Nov 25

Godfrey Phillips India Ltd. has announced 2:10 stock split, ex-date: 28 Nov 14

Godfrey Phillips India Ltd. has announced 2:1 bonus issue, ex-date: 16 Sep 25

No Rights history available
Quality key factors
Valuation key factors
Technicals key factors
 Technical Indicator Scale: Bearish, Mildly Bearish, Sideways, Mildly Bullish, Bullish Turned
 Shareholding Snapshot : Mar 2026
Shareholding Compare (%holding)
Promoters
0.212
Held by 27 Schemes (3.01%)
Held by 148 FIIs (7.91%)
K K Modi Investment And Financial Services Pvt Ltd (29.85%)
Jupiter India Fund (3.15%)
13.33%
Quarterly Results Snapshot (Consolidated) - Mar'26 - YoY

YoY Growth in quarter ended Mar 2026 is 13.59% vs 79.76% in Mar 2025

YoY Growth in quarter ended Mar 2026 is 86.71% vs 30.41% in Mar 2025
Half Yearly Results Snapshot (Consolidated) - Sep'25
Growth in half year ended Sep 2025 is 13.33% vs 11.10% in Sep 2024
Growth in half year ended Sep 2025 is 38.68% vs 4.46% in Sep 2024
Nine Monthly Results Snapshot (Consolidated) - Dec'25
YoY Growth in nine months ended Dec 2025 is 14.02% vs 16.90% in Dec 2024
YoY Growth in nine months ended Dec 2025 is 26.73% vs 18.52% in Dec 2024
Annual Results Snapshot (Consolidated) - Mar'26
YoY Growth in year ended Mar 2026 is 13.90% vs 39.64% in Mar 2025
YoY Growth in year ended Mar 2026 is 42.35% vs 21.40% in Mar 2025
About Godfrey Phillips India Ltd.

Company Coordinates


