
Compare Remedium Life with Similar Stocks
Dashboard
Weak Long Term Fundamental Strength as the company has not declared results in the last 6 months
- Company's ability to service its debt is weak with a poor EBIT to Interest (avg) ratio of -0.21
- The company has reported losses. Due to this company has reported negative ROCE
With a fall in Net Sales of -65.79%, the company declared Very Negative results in Sep 25
Risky - Negative EBITDA
Stock DNA
Trading & Distributors
INR 27 Cr (Micro Cap)
NA (Loss Making)
21
0.00%
10.33
2.02%
0.27
Total Returns (Price + Dividend) 
Remedium Life for the last several years.
Risk Adjusted Returns v/s
Returns Beta

News
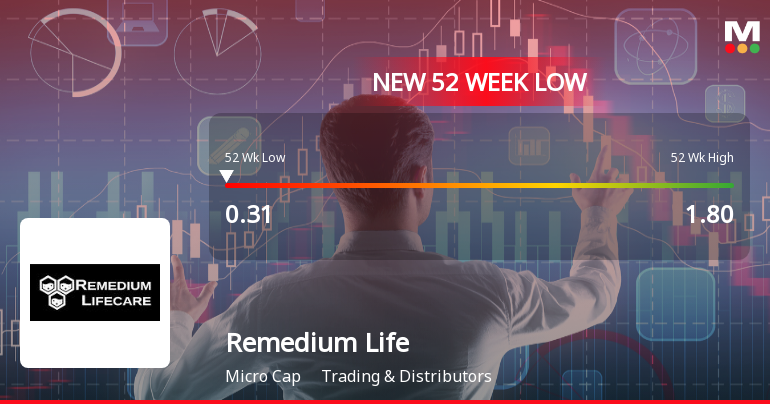
Remedium Lifecare Ltd Falls to 52-Week Low of Rs 0.31 as Sell-Off Deepens
For the seventh consecutive session, Remedium Lifecare Ltd has closed lower, culminating in a fresh 52-week low of Rs 0.31 on 9 June 2026. This persistent decline has dragged the stock down by 18.42% over this period, underscoring a sustained sell-off amid weak fundamentals and challenging market conditions.
Read full news article
Remedium Lifecare Ltd is Rated Strong Sell
Remedium Lifecare Ltd is rated Strong Sell by MarketsMOJO, with this rating last updated on 16 Nov 2024. However, the analysis and financial metrics discussed here reflect the stock’s current position as of 27 May 2026, providing investors with the latest insights into the company’s performance and outlook.
Read full news article
Remedium Lifecare Ltd is Rated Strong Sell
Remedium Lifecare Ltd is rated Strong Sell by MarketsMOJO. This rating was last updated on 16 Nov 2024, reflecting a significant reassessment of the stock’s outlook. However, the analysis and financial metrics presented here are based on the company’s current position as of 13 May 2026, providing investors with the latest insights into its performance and prospects.
Read full news article Announcements
Intimation Of Change In Insolvency Professional - Appointment Of Resolution Professional (RP) In Place Of Interim Resolution Professional (IRP)
12-May-2026 | Source : BSEAppointment of Resolution Professional in place of Interim Resolution Professional
Post- Coc Update
17-Apr-2026 | Source : BSEDisclosure to take note of decisions taken in 1st COC meeting held on 14.04.2026
Corporate Insolvency Resolution Process (CIRP)-List of Creditors
10-Apr-2026 | Source : BSEThis disclosure is to place on record List of Creditors as required to be placed under Reg 13(2)(c) of IBBI CIRP Regulations
Corporate Actions

No Upcoming Board Meetings

No Dividend history available

Remedium Lifecare Ltd has announced 1:5 stock split, ex-date: 23 Feb 24

Remedium Lifecare Ltd has announced 3:1 bonus issue, ex-date: 05 Jul 24

Remedium Lifecare Ltd has announced 61:50 rights issue, ex-date: 15 Apr 25
Quality key factors
Valuation key factors
Technicals key factors
 Technical Indicator Scale: Bearish, Mildly Bearish, Sideways, Mildly Bullish, Bullish Turned
 Shareholding Snapshot : Dec 2025
Shareholding Compare (%holding)
Non Institution
None
Held by 0 Schemes
Held by 1 FIIs (1.7%)
Siddharth Chimanlal Shah (1.13%)
Uppinangady Sudhindra Nayak (3.2%)
81.29%
Quarterly Results Snapshot (Standalone) - Sep'25 - YoY

YoY Growth in quarter ended Sep 2025 is -65.79% vs -94.65% in Sep 2024

YoY Growth in quarter ended Sep 2025 is -96.07% vs -72.74% in Sep 2024
Half Yearly Results Snapshot (Standalone) - Sep'25
Growth in half year ended Sep 2025 is -73.78% vs -87.14% in Sep 2024
Growth in half year ended Sep 2025 is -109.21% vs -73.24% in Sep 2024
Nine Monthly Results Snapshot (Standalone) - Dec'24
YoY Growth in nine months ended Dec 2024 is -94.65% vs 506.37% in Dec 2023
YoY Growth in nine months ended Dec 2024 is -93.21% vs 464.05% in Dec 2023
Annual Results Snapshot (Standalone) - Mar'25
YoY Growth in year ended Mar 2025 is -94.49% vs 692.74% in Mar 2024
YoY Growth in year ended Mar 2025 is -95.33% vs 502.76% in Mar 2024
About Remedium Lifecare Ltd

Company Coordinates


