
Compare AGI Infra with Similar Stocks
Dashboard
Strong ability to service debt as the company has a low Debt to EBITDA ratio of 1.51 times
The company has declared Positive results for the last 4 consecutive quarters
With ROCE of 18.3, it has a Very Expensive valuation with a 8.2 Enterprise value to Capital Employed
Increasing Participation by Institutional Investors
Consistent Returns over the last 3 years
Total Returns (Price + Dividend) 
Latest dividend: 0.1 per share ex-dividend date: Mar-19-2025
Risk Adjusted Returns v/s
Returns Beta

News

AGI Infra Ltd is Rated Hold by MarketsMOJO
AGI Infra Ltd is rated 'Hold' by MarketsMOJO, with this rating last updated on 23 June 2025. However, the analysis and financial metrics discussed here reflect the stock's current position as of 06 July 2026, providing investors with an up-to-date view of the company’s fundamentals, valuation, financial trends, and technical outlook.
Read full news article
AGI Infra Ltd is Rated Hold by MarketsMOJO
AGI Infra Ltd is rated 'Hold' by MarketsMOJO, with this rating last updated on 23 June 2025. However, the analysis and financial metrics discussed here reflect the company’s current position as of 25 June 2026, providing investors with an up-to-date view of the stock’s fundamentals, returns, and market standing.
Read full news article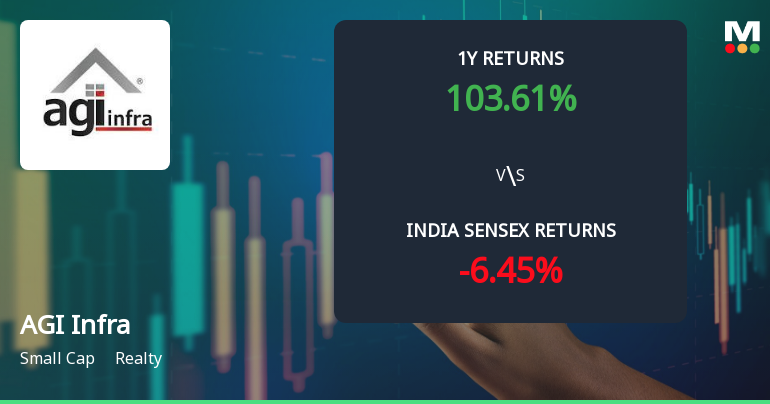
AGI Infra Ltd Technical Momentum Shifts Amid Mixed Market Signals
AGI Infra Ltd, a small-cap player in the realty sector, has experienced a nuanced shift in its technical momentum, reflecting a complex interplay of bullish and bearish signals across multiple timeframes. Despite a recent downgrade from a Sell to a Hold rating by MarketsMOJO on 23 June 2025, the stock’s year-to-date return of 39.54% significantly outpaces the Sensex’s negative 9.54%, underscoring its resilience amid broader market volatility.
Read full news article Announcements
Shareholder Meeting / Postal Ballot-Scrutinizers Report
27-Jun-2026 | Source : BSESubmission of Scrutinizers Report and Voting Results
Shareholder Meeting / Postal Ballot-Outcome of Postal_Ballot
26-Jun-2026 | Source : BSEOutcome of Postal Ballot
Closure of Trading Window
25-Jun-2026 | Source : BSEIntimation of Closure of Trading Window
Corporate Actions

No Upcoming Board Meetings

AGI Infra Ltd has declared 10% dividend, ex-date: 19 Mar 25

AGI Infra Ltd has announced 1:5 stock split, ex-date: 10 Oct 25

No Bonus history available

No Rights history available
Quality key factors
Valuation key factors
Technicals key factors
 Technical Indicator Scale: Bearish, Mildly Bearish, Sideways, Mildly Bullish, Bullish Turned
 Shareholding Snapshot : Mar 2026
Shareholding Compare (%holding)
Promoters
None
Held by 0 Schemes
Held by 18 FIIs (3.98%)
Sukhdev Singh Khinda (44.24%)
Chungath Karunakaran Padma Kumar (4.8%)
10.81%
Quarterly Results Snapshot (Consolidated) - Mar'26 - YoY

YoY Growth in quarter ended Mar 2026 is 5.81% vs 4.32% in Mar 2025
YoY Growth in quarter ended Mar 2026 is 69.57% vs 68.52% in Mar 2025
Half Yearly Results Snapshot (Consolidated) - Sep'25
Growth in half year ended Sep 2025 is 17.80% vs 7.50% in Sep 2024
Growth in half year ended Sep 2025 is 31.97% vs 14.52% in Sep 2024
Nine Monthly Results Snapshot (Consolidated) - Dec'25

YoY Growth in nine months ended Dec 2025 is 9.45% vs 13.69% in Dec 2024
YoY Growth in nine months ended Dec 2025 is 33.85% vs 19.13% in Dec 2024
Annual Results Snapshot (Consolidated) - Mar'26
YoY Growth in year ended Mar 2026 is 8.52% vs 11.13% in Mar 2025
YoY Growth in year ended Mar 2026 is 42.30% vs 27.97% in Mar 2025
About AGI Infra Ltd

Company Coordinates


