
Compare Gallantt Ispat L with Similar Stocks
Stock DNA
Iron & Steel Products
INR 12,795 Cr (Small Cap)
27.00
24
0.22%
0.01
14.65%
3.93
Total Returns (Price + Dividend) 
Latest dividend: 1.2 per share ex-dividend date: Sep-12-2025
Risk Adjusted Returns v/s
Returns Beta

News
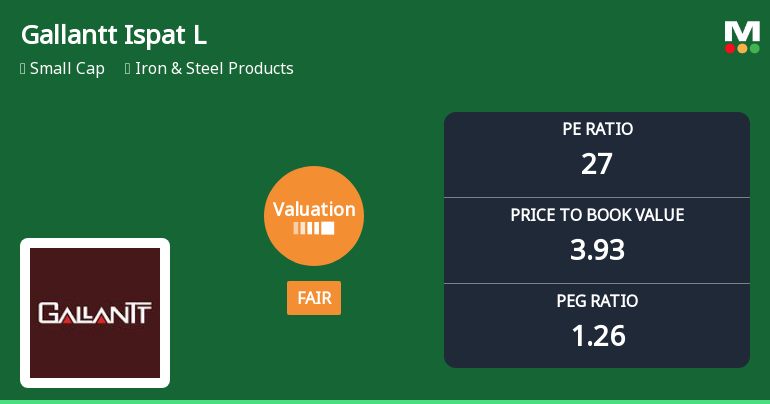
Gallantt Ispat Ltd: Valuation Shift Signals Renewed Price Attractiveness Amid Market Volatility
Gallantt Ispat Ltd., a small-cap player in the Iron & Steel Products sector, has recently undergone a notable shift in its valuation parameters, moving from an expensive to a fair valuation grade. This change comes amid a 4.57% decline in its share price and a downgrade in its Mojo Grade from Hold to Sell as of 20 July 2026. This article analyses the implications of these valuation changes, compares Gallantt Ispat’s metrics with its peers, and examines its price attractiveness in the current market context.
Read full news articleWhen is the next results date for Gallantt Ispat Ltd.?
The next results date for Gallantt Ispat Ltd. is scheduled for July 27, 2026....
Read full news article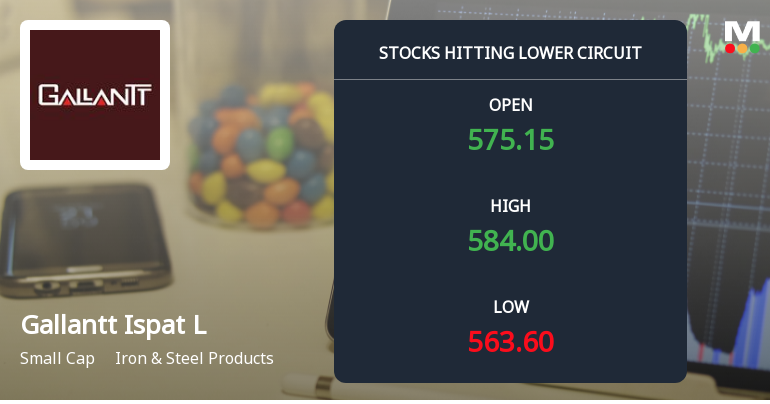
Gallantt Ispat Ltd. Locks at Lower Circuit With 4.66% Loss — Sellers Queue, No Buyers in Sight
At Rs 563.45, sellers were still queuing — but there were no buyers willing to take the other side. Gallantt Ispat Ltd. locked at its lower circuit of 4.66% on 22 Jul 2026, with unfilled sell orders and a frozen price, signalling persistent selling pressure in a thinly traded small-cap stock.
Read full news article Announcements
Board Meeting Intimation for Consideration And Approval Of Unaudited Financial Results For The Quarter Ended 30Th June 2026 And Other Business Matters
21-Jul-2026 | Source : BSEGallantt Ispat Ltdhas informed BSE that the meeting of the Board of Directors of the Company is scheduled on 27/07/2026 inter alia to consider and approve Unaudited Financial Results of the Company for the quarter ended 30th June 2026 and proposal to change Statutory Auditors of the Company.
Announcement under Regulation 30 (LODR)-Resignation of Chief Financial Officer (CFO)
15-Jul-2026 | Source : BSEIntimation regarding resignation of Chief Financial Officer (CFO) of the Company.
Announcement under Regulation 30 (LODR)-Change in Management
15-Jul-2026 | Source : BSEIntimation regarding change in management of the Company due to resignation of CFO.
Corporate Actions

27 Jul 2026

Gallantt Ispat Ltd. has declared 12% dividend, ex-date: 12 Sep 25

No Splits history available

No Bonus history available

No Rights history available
Quality key factors
Valuation key factors
Technicals key factors
 Technical Indicator Scale: Bearish, Mildly Bearish, Sideways, Mildly Bullish, Bullish Turned
 Shareholding Snapshot : Jun 2026
Shareholding Compare (%holding)
Promoters
None
Held by 17 Schemes (0.08%)
Held by 5 FIIs (0.02%)
Gallantt Trust (60.05%)
Nihon Impex Private Limited (17.6%)
9.96%
Quarterly Results Snapshot (Consolidated) - Mar'26 - QoQ

QoQ Growth in quarter ended Mar 2026 is 12.22% vs 6.01% in Dec 2025
QoQ Growth in quarter ended Mar 2026 is 22.33% vs 12.91% in Dec 2025
Half Yearly Results Snapshot (Consolidated) - Sep'25

Growth in half year ended Sep 2025 is 1.82% vs 5.85% in Sep 2024
Growth in half year ended Sep 2025 is 53.85% vs 118.98% in Sep 2024
Nine Monthly Results Snapshot (Consolidated) - Dec'25
YoY Growth in nine months ended Dec 2025 is -0.20% vs 5.64% in Dec 2024
YoY Growth in nine months ended Dec 2025 is 27.67% vs 118.86% in Dec 2024
Annual Results Snapshot (Consolidated) - Mar'26
YoY Growth in year ended Mar 2026 is 2.94% vs 1.55% in Mar 2025
YoY Growth in year ended Mar 2026 is 20.84% vs 77.83% in Mar 2025
About Gallantt Ispat Ltd.

Company Coordinates


