
Compare Gallantt Ispat L with Similar Stocks
Dashboard
Company has a Debt to Equity ratio (avg) of 0.10 times
Healthy long term growth as Net Sales has grown by an annual rate of 23.71% and Operating profit at 28.08%
Flat results in Jun 26
With ROE of 14.7, it has a Expensive valuation with a 4.5 Price to Book Value
Despite the size of the company, domestic mutual funds hold only 0.26% of the company
Underperformed the market in the last 1 year
Stock DNA
Iron & Steel Products
INR 14,207 Cr (Small Cap)
34.00
24
0.20%
0.01
14.65%
4.29
Total Returns (Price + Dividend) 
Latest dividend: 1.2 per share ex-dividend date: Sep-12-2025
Risk Adjusted Returns v/s
Returns Beta

News

Gallantt Ispat Ltd. Locks at Upper Circuit With 5.0% Gain — Buyers Queue, Sellers Absent
At Rs 614.6, the buying was done — not because demand dried up, but because the exchange wouldn't let the stock go any higher. Gallantt Ispat Ltd. locked at its upper circuit of 5.0% on 30 Jul 2026, with buyers queuing and no sellers willing to part with shares.
Read full news article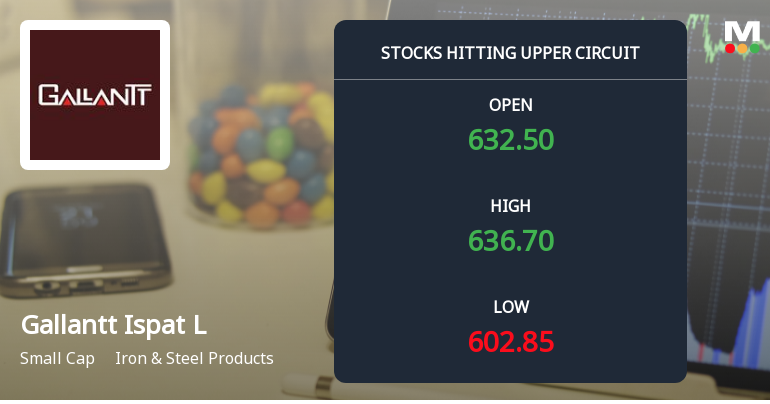
Gallantt Ispat Ltd. Locks at Upper Circuit With 3.51% Gain — Buyers Queue, Sellers Absent
At Rs 633.45, the buying was done — not because demand dried up, but because the exchange wouldn't let the stock go any higher. Gallantt Ispat Ltd. locked at its upper circuit of 5% on 30 Jul 2026, with buyers queuing and no sellers willing to part with shares.
Read full news article
Gallantt Ispat Ltd. Locks at Upper Circuit With 5% Gain — Buyers Queue, Sellers Absent
At Rs 603.3, the buying was done — not because demand dried up, but because the exchange wouldn't let the stock go any higher. Gallantt Ispat Ltd. locked at its upper circuit of 5% on 28 Jul 2026, with buyers queuing and no sellers willing to part with shares.
Read full news article Announcements
Announcement under Regulation 30 (LODR)-Investor Presentation
29-Jul-2026 | Source : BSESubmission of revised investor presentation on unaudited financial results for the quarter ended 30th June 2026.
Announcement under Regulation 30 (LODR)-Newspaper Publication
29-Jul-2026 | Source : BSESubmission of newspaper cuttings publishing extracts of the financial results of the Company for the quarter ended 30th June 2026.
Announcement under Regulation 30 (LODR)-Press Release / Media Release (Revised)
29-Jul-2026 | Source : BSESubmission of revised Press Release with respect to financial results of the Company for the quarter ended 30th June 2026.
Corporate Actions

No Upcoming Board Meetings

Gallantt Ispat Ltd. has declared 12% dividend, ex-date: 12 Sep 25

No Splits history available

No Bonus history available

No Rights history available
Quality key factors
Valuation key factors
Technicals key factors
 Technical Indicator Scale: Bearish, Mildly Bearish, Sideways, Mildly Bullish, Bullish Turned
 Shareholding Snapshot : Jun 2026
Shareholding Compare (%holding)
Promoters
None
Held by 17 Schemes (0.08%)
Held by 5 FIIs (0.02%)
Gallantt Trust (60.05%)
Nihon Impex Private Limited (17.6%)
9.96%
Quarterly Results Snapshot (Consolidated) - Jun'26 - QoQ

QoQ Growth in quarter ended Jun 2026 is -4.91% vs 12.22% in Mar 2026
QoQ Growth in quarter ended Jun 2026 is 0.68% vs 22.33% in Mar 2026
Half Yearly Results Snapshot (Consolidated) - Sep'25
Growth in half year ended Sep 2025 is 1.82% vs 5.85% in Sep 2024
Growth in half year ended Sep 2025 is 53.85% vs 118.98% in Sep 2024
Nine Monthly Results Snapshot (Consolidated) - Dec'25
YoY Growth in nine months ended Dec 2025 is -0.20% vs 5.64% in Dec 2024
YoY Growth in nine months ended Dec 2025 is 27.67% vs 118.86% in Dec 2024
Annual Results Snapshot (Consolidated) - Mar'26

YoY Growth in year ended Mar 2026 is 2.94% vs 1.55% in Mar 2025
YoY Growth in year ended Mar 2026 is 20.84% vs 77.83% in Mar 2025
About Gallantt Ispat Ltd.

Company Coordinates


