
Compare Emami Paper with Similar Stocks
Dashboard
Low ability to service debt as the company has a high Debt to EBITDA ratio of 4.17 times
- Low ability to service debt as the company has a high Debt to EBITDA ratio of 4.17 times
Poor long term growth as Net Sales has grown by an annual rate of 9.41% and Operating profit at 3.13% over the last 5 years
With a growth in Net Profit of 85.4%, the company declared Very Positive results in Mar 26
With ROCE of 10.2, it has a Attractive valuation with a 1 Enterprise value to Capital Employed
Despite the size of the company, domestic mutual funds hold only 0% of the company
Stock DNA
Paper, Forest & Jute Products
INR 515 Cr (Micro Cap)
8.00
17
1.85%
1.42
10.80%
0.91
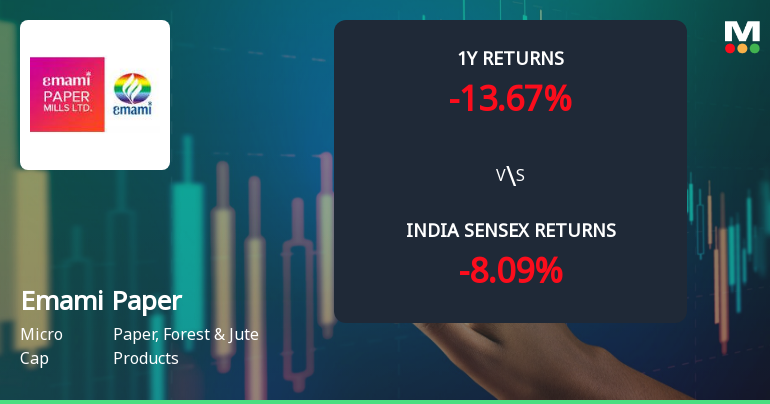
Total Returns (Price + Dividend) 
Latest dividend: 1.6 per share ex-dividend date: Aug-26-2025
Risk Adjusted Returns v/s
Returns Beta

News
Emami Paper Mills Ltd Technical Momentum Shifts Amid Mixed Market Signals
Emami Paper Mills Ltd has experienced a notable shift in its technical momentum, moving from a mildly bearish stance to a sideways trend, reflecting a complex interplay of bullish and bearish signals across key indicators. Despite a slight dip in the stock price to ₹86.03 on 2 Jul 2026, the evolving technical landscape suggests cautious optimism for investors navigating this micro-cap paper sector stock.
Read full news article
Emami Paper Mills Ltd Technical Momentum Shifts Amid Mixed Market Signals
Emami Paper Mills Ltd has experienced a notable shift in its technical momentum, transitioning from a sideways trend to a mildly bearish stance. Despite a recent upgrade in its Mojo Grade from Sell to Hold, the stock’s technical indicators present a complex picture, with weekly and monthly signals diverging across key metrics such as MACD, RSI, Bollinger Bands, and moving averages.
Read full news article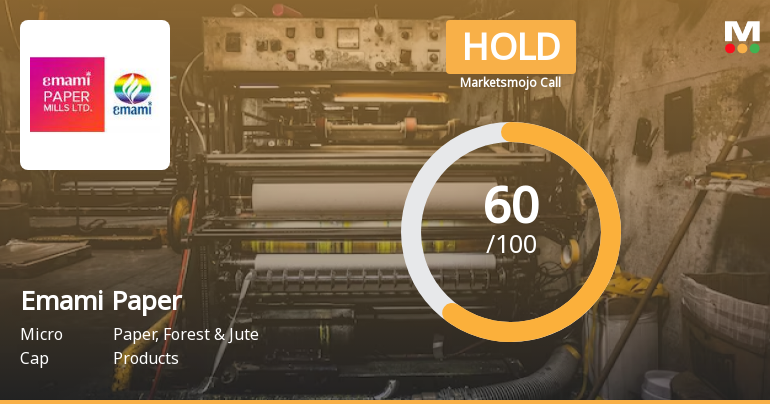
Emami Paper Mills Ltd is Rated Hold
Emami Paper Mills Ltd is rated 'Hold' by MarketsMOJO, with this rating last updated on 28 April 2026. However, the analysis and financial metrics discussed here reflect the stock's current position as of 23 June 2026, providing investors with an up-to-date perspective on the company’s fundamentals, valuation, financial trends, and technical outlook.
Read full news article Announcements
Closure of Trading Window
26-Jun-2026 | Source : BSEIntimation of the closure of Trading Window w.e.f 1st July 2026 till the end of the 48 hours after the declaration of the Unaudited Financial Results of the Company for the First Quarter ending on 30th June 2026.
Compliances-Reg.24(A)-Annual Secretarial Compliance
29-May-2026 | Source : BSEWe hereby submit the Secretarial Compliance Report for the year ended 31st March 2026.
Announcement under Regulation 30 (LODR)-Newspaper Publication
29-May-2026 | Source : BSEWe hereby submit the newspaper clippings of the Audited Financial Results of Emami Paper Mills Limited for the 4th Quarter and Year ended 31st March 2026 published today i.e. 29th May 2026.
Corporate Actions

No Upcoming Board Meetings

Emami Paper Mills Ltd has declared 80% dividend, ex-date: 26 Aug 25

No Splits history available

No Bonus history available

No Rights history available
Quality key factors
Valuation key factors
Technicals key factors
 Technical Indicator Scale: Bearish, Mildly Bearish, Sideways, Mildly Bullish, Bullish Turned
 Shareholding Snapshot : Mar 2026
Shareholding Compare (%holding)
Promoters
None
Held by 0 Schemes
Held by 3 FIIs (0.53%)
Diwakar Finvest Private Limited (27.03%)
Bpc Tradecom Private Limited (4.58%)
11.38%
Quarterly Results Snapshot (Standalone) - Mar'26 - QoQ

QoQ Growth in quarter ended Mar 2026 is -0.81% vs 11.06% in Dec 2025
QoQ Growth in quarter ended Mar 2026 is 85.40% vs 158.21% in Dec 2025
Half Yearly Results Snapshot (Standalone) - Sep'25
Growth in half year ended Sep 2025 is -8.85% vs 4.56% in Sep 2024
Growth in half year ended Sep 2025 is -36.78% vs 15.00% in Sep 2024
Nine Monthly Results Snapshot (Standalone) - Dec'25
YoY Growth in nine months ended Dec 2025 is -2.91% vs -1.18% in Dec 2024

YoY Growth in nine months ended Dec 2025 is 35.26% vs -61.31% in Dec 2024
Annual Results Snapshot (Standalone) - Mar'26
YoY Growth in year ended Mar 2026 is -1.08% vs -3.30% in Mar 2025
YoY Growth in year ended Mar 2026 is 135.99% vs -69.15% in Mar 2025
About Emami Paper Mills Ltd

Company Coordinates


