
Compare Honda India with Similar Stocks
Stock DNA
Industrial Manufacturing
INR 2,235 Cr (Small Cap)
31.00
61
5.63%
-0.10
8.90%
2.80
Total Returns (Price + Dividend) 
Latest dividend: 3.510264159391091 per share ex-dividend date: Feb-18-2026
Risk Adjusted Returns v/s
Returns Beta

News
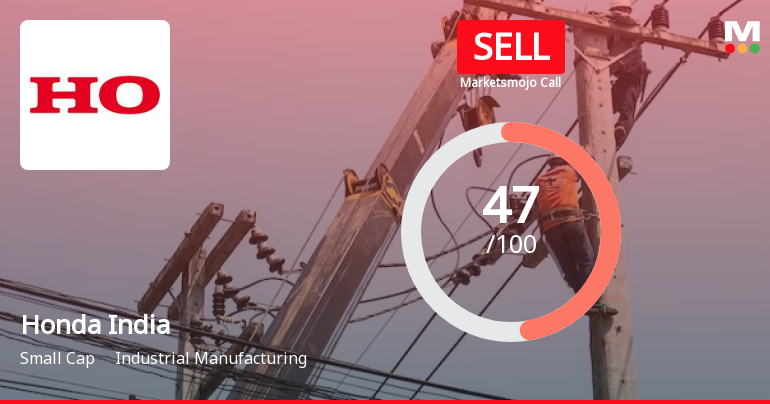
Honda India Power Products Ltd is Rated Sell
Honda India Power Products Ltd is rated Sell by MarketsMOJO, with this rating last updated on 27 May 2026. However, the analysis and financial metrics discussed here reflect the stock’s current position as of 20 June 2026, providing investors with the latest insights into its performance and outlook.
Read full news article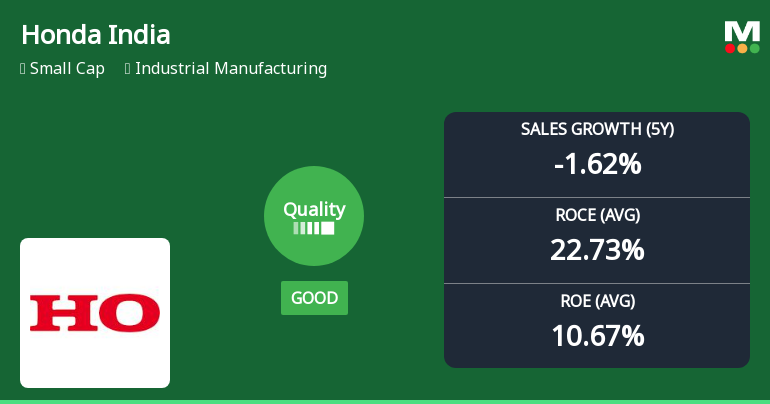
Honda India Power Products Ltd Quality Grade Upgrade Highlights Mixed Business Fundamentals
Honda India Power Products Ltd has recently seen its quality rating upgraded from average to good, reflecting notable improvements in key business fundamentals. This article analyses the changes in profitability, capital efficiency, debt levels, and consistency metrics that underpin this upgrade, providing investors with a comprehensive view of the company’s evolving financial health and market positioning.
Read full news article
Honda India Power Products Ltd is Rated Sell
Honda India Power Products Ltd is rated 'Sell' by MarketsMOJO, with this rating last updated on 27 May 2026. However, the analysis and financial metrics discussed here reflect the stock's current position as of 09 June 2026, providing investors with the latest insights into the company’s performance and outlook.
Read full news article Announcements
Announcement under Regulation 30 (LODR)-Newspaper Publication
09-Jun-2026 | Source : BSENewspaper Advertisement regarding Special Window for Transfer and Dematerialisation of Physical Securities
Announcement under Regulation 30 (LODR)-Newspaper Publication
06-Jun-2026 | Source : BSENewspaper Advertisement regarding Transfer of Shares to IEPF.
Announcement under Regulation 30 (LODR)-Newspaper Publication
06-Jun-2026 | Source : BSENewspaper Advertisement regarding Transfer of Shares to IEPF.
Corporate Actions

No Upcoming Board Meetings

Honda India Power Products Ltd has declared 35% dividend, ex-date: 18 Feb 26

No Splits history available

No Bonus history available

No Rights history available
Quality key factors
Valuation key factors
Technicals key factors
 Technical Indicator Scale: Bearish, Mildly Bearish, Sideways, Mildly Bullish, Bullish Turned
 Shareholding Snapshot : Mar 2026
Shareholding Compare (%holding)
Promoters
None
Held by 4 Schemes (18.26%)
Held by 45 FIIs (1.05%)
Honda Motor Co. Ltd (66.67%)
Nippon Life India Trustee Ltd (8.86%)
12.2%
Quarterly Results Snapshot (Standalone) - Mar'26 - YoY

YoY Growth in quarter ended Mar 2026 is -1.54% vs 16.23% in Mar 2025
YoY Growth in quarter ended Mar 2026 is -25.55% vs 128.86% in Mar 2025
Half Yearly Results Snapshot (Standalone) - Sep'25

Growth in half year ended Sep 2025 is 2.85% vs -35.02% in Sep 2024
Growth in half year ended Sep 2025 is -16.36% vs -48.66% in Sep 2024
Nine Monthly Results Snapshot (Standalone) - Dec'25
YoY Growth in nine months ended Dec 2025 is 14.34% vs -30.66% in Dec 2024
YoY Growth in nine months ended Dec 2025 is -14.76% vs -42.70% in Dec 2024
Annual Results Snapshot (Standalone) - Mar'26
YoY Growth in year ended Mar 2026 is 8.97% vs -19.70% in Mar 2025
YoY Growth in year ended Mar 2026 is -19.64% vs -13.31% in Mar 2025
About Honda India Power Products Ltd

Company Coordinates


