
Compare Shekhawati Inds with Similar Stocks
Stock DNA
Garments & Apparels
INR 47 Cr (Micro Cap)
5.00
25
0.00%
-0.19
40.02%
2.13
Total Returns (Price + Dividend) 
Shekhawati Inds for the last several years.
Risk Adjusted Returns v/s
Returns Beta

News
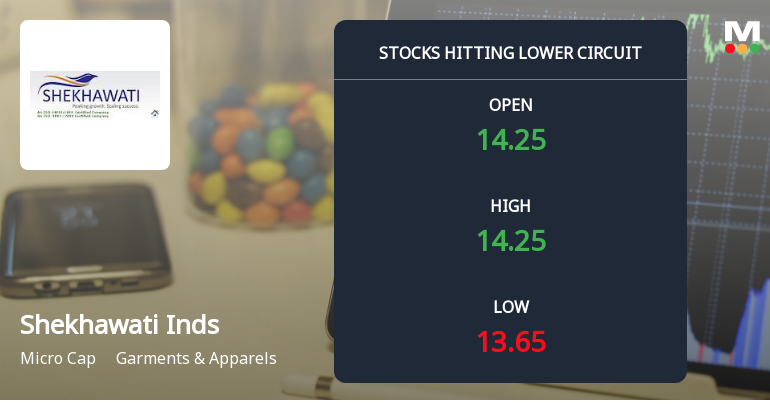
Shekhawati Industries Ltd Locks at Lower Circuit With 1.39% Loss — Sellers Queue, No Buyers in Sight
At Rs 14.16, sellers were still queuing — but there were no buyers willing to take the other side. Shekhawati Industries Ltd locked at its lower circuit of 1.39% on 24 Jun 2026, with unfilled sell orders and a frozen price, reflecting persistent selling pressure in a micro-cap stock with limited liquidity.
Read full news article
Shekhawati Industries Ltd Upgraded to Sell on Improved Valuation and Financial Metrics
Shekhawati Industries Ltd, a micro-cap player in the Garments & Apparels sector, has seen its investment rating upgraded from Strong Sell to Sell as of 19 Jun 2026. This change reflects a reassessment across four key parameters: Quality, Valuation, Financial Trend, and Technicals, driven by recent financial performance and valuation improvements despite ongoing challenges in long-term fundamentals.
Read full news article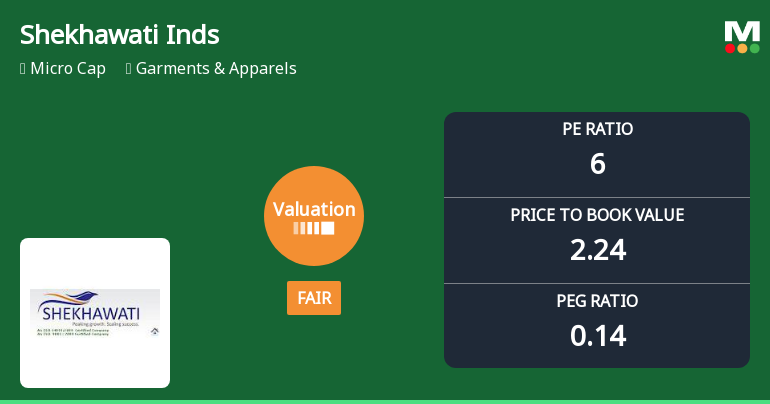
Shekhawati Industries Ltd Valuation Shifts to Fair Amidst Mixed Market Returns
Shekhawati Industries Ltd, a micro-cap player in the Garments & Apparels sector, has seen its valuation parameters shift notably, moving from an expensive to a fair valuation grade. Despite a recent downgrade in its Mojo Grade to Sell from Strong Sell, the company’s price-to-earnings (P/E) and price-to-book value (P/BV) ratios now present a more attractive entry point relative to its historical and peer averages. This article analyses the valuation changes, financial metrics, and market performance to provide a comprehensive view for investors.
Read full news article Announcements
Announcement under Regulation 30 (LODR)-Cessation
22-Jun-2026 | Source : BSEPlease take on record the cessation of Mr. Sushil Kumar Poddar as an Independent Director w.e.f 22.06.2026
Shareholder Meeting / Postal Ballot-Scrutinizers Report
18-Jun-2026 | Source : BSEPlease find the 35th Annual General Meeting Evoting Report and Scrutinizers Report for the meeting held on 17.06.2026 at 12.30 p.m. through Video Conferencing (VC) and Other Audio Visual Mean (OAVM)
Shareholder Meeting / Postal Ballot-Outcome of AGM
17-Jun-2026 | Source : BSEPlease find the outcome and proceedings of 35th Annual General Meeting held on 17th June 2026 at 12.30 p.m.
Corporate Actions

No Upcoming Board Meetings

No Dividend history available

Shekhawati Industries Ltd has announced 10:1 stock split, ex-date: 28 Aug 24

No Bonus history available

No Rights history available
Quality key factors
Valuation key factors
Technicals key factors
 Technical Indicator Scale: Bearish, Mildly Bearish, Sideways, Mildly Bullish, Bullish Turned
 Shareholding Snapshot : Mar 2026
Shareholding Compare (%holding)
Promoters
None
Held by 0 Schemes
Held by 0 FIIs
Mukesh Ramniranjan Ruia (22.92%)
Amax Network Pvt Ltd (3.21%)
28.93%
Quarterly Results Snapshot (Standalone) - Mar'26 - QoQ

QoQ Growth in quarter ended Mar 2026 is 282.16% vs -29.00% in Dec 2025
QoQ Growth in quarter ended Mar 2026 is 1,007.84% vs -127.27% in Dec 2025
Half Yearly Results Snapshot (Standalone) - Sep'25

Growth in half year ended Sep 2025 is -82.55% vs 12.83% in Sep 2024
Growth in half year ended Sep 2025 is -4.67% vs -20.90% in Sep 2024
Nine Monthly Results Snapshot (Standalone) - Dec'25
YoY Growth in nine months ended Dec 2025 is -83.63% vs 13.93% in Dec 2024
YoY Growth in nine months ended Dec 2025 is -34.99% vs -25.06% in Dec 2024
Annual Results Snapshot (Standalone) - Mar'26
YoY Growth in year ended Mar 2026 is -73.16% vs -21.03% in Mar 2025
YoY Growth in year ended Mar 2026 is 40.29% vs -95.92% in Mar 2025
About Shekhawati Industries Ltd

Company Coordinates


