
Key Events This Week
13 Jul 2026: Valuation shifts signal renewed price attractiveness
14 Jul 2026: Upgrade to Sell rating on improved valuation and financial metrics
17 Jul 2026: Week closes at Rs.12.82, down 8.43% for the week
Jul 17, 03:30 PM
BSE+NSE Vol: 54.7 k
Garments & Apparels
INR 46 Cr (Micro Cap)
5.00
26
0.00%
-0.19
40.02%
2.11
Shekhawati Inds for the last several years.

13 Jul 2026: Valuation shifts signal renewed price attractiveness
14 Jul 2026: Upgrade to Sell rating on improved valuation and financial metrics
17 Jul 2026: Week closes at Rs.12.82, down 8.43% for the week

Shekhawati Industries Ltd, a micro-cap player in the Garments & Apparels sector, has seen its investment rating upgraded from Strong Sell to Sell as of 13 July 2026. This change reflects a notable improvement in valuation metrics and recent financial performance, despite ongoing challenges in long-term fundamentals and market underperformance.
Read full news article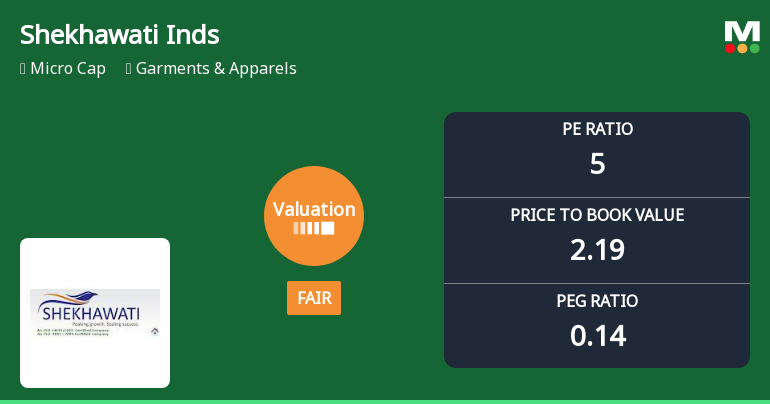
Shekhawati Industries Ltd, a micro-cap player in the Garments & Apparels sector, has witnessed a notable shift in its valuation parameters, moving from an expensive to a fair valuation grade. This transition is underscored by its current price-to-earnings (P/E) ratio of 5.48 and price-to-book value (P/BV) of 2.19, positioning the stock as more attractively priced relative to its historical levels and peer group. Despite a recent downgrade in its Mojo Grade to Strong Sell, the company’s valuation metrics and return profile warrant a detailed examination for investors seeking value opportunities within the sector.
Read full news articlePlease find the Certificate under Regulation 74(5) of SEBI (DP) Regulations 2018 received from RTA for the quarter ended on 30.06.2026
Intimation of closure of Trading window from 01.07.2026 for company designated person or immediate relatives covered under Regulation and will open after expiry of 48 hours post the Unaudited Financial Result for the Quarter Ended on 30.06.2026
Please take on record the cessation of Mr. Sushil Kumar Poddar as an Independent Director w.e.f 22.06.2026

No Upcoming Board Meetings

No Dividend history available

Shekhawati Industries Ltd has announced 10:1 stock split, ex-date: 28 Aug 24

No Bonus history available

No Rights history available
 Technical Indicator Scale: Bearish, Mildly Bearish, Sideways, Mildly Bullish, Bullish Turned
 Promoters
None
Held by 0 Schemes
Held by 0 FIIs
Mukesh Ramniranjan Ruia (22.92%)
Amax Network Pvt Ltd (3.21%)
28.93%

QoQ Growth in quarter ended Mar 2026 is 282.16% vs -29.00% in Dec 2025
QoQ Growth in quarter ended Mar 2026 is 1,007.84% vs -127.27% in Dec 2025

Growth in half year ended Sep 2025 is -82.55% vs 12.83% in Sep 2024
Growth in half year ended Sep 2025 is -4.67% vs -20.90% in Sep 2024
YoY Growth in nine months ended Dec 2025 is -83.63% vs 13.93% in Dec 2024
YoY Growth in nine months ended Dec 2025 is -34.99% vs -25.06% in Dec 2024
YoY Growth in year ended Mar 2026 is -73.16% vs -21.03% in Mar 2025
YoY Growth in year ended Mar 2026 is 40.29% vs -95.92% in Mar 2025


