
Compare Sanathnagar Ent. with Similar Stocks
Dashboard
With a Negative Book Value, the company has a Weak Long Term Fundamental Strength
- Poor long term growth as Net Sales has grown by an annual rate of -27.50% and Operating profit at 0% over the last 5 years
- The company has a negative book value of Rs 12.37 crore
Flat results in Jun 26
Risky - Negative EBITDA
Underperformed the market in the last 1 year
Total Returns (Price + Dividend) 
Sanathnagar Ent. for the last several years.
Risk Adjusted Returns v/s
Returns Beta

News
Are Sanathnagar Enterprises Ltd latest results good or bad?
Sanathnagar Enterprises Ltd's latest financial results for Q1 FY27 reveal a challenging operational landscape. The company reported a net loss of ₹0.06 crores, which reflects a significant year-on-year decline of 50%. Notably, the company has not generated any revenue, maintaining a consistent pattern of zero sales across multiple quarters. This absence of revenue generation indicates a complete lack of operational activity, which raises concerns about the company's viability. The financial metrics highlight persistent operational challenges. The operating profit before depreciation, interest, and tax (excluding other income) also registered a loss of ₹0.06 crores, suggesting that the company is unable to cover even its basic administrative and employee costs. Employee expenses, while minimal at ₹0.02 crores, continue to contribute to the overall losses. The company's market capitalization stands at ₹9.9...
Read full news article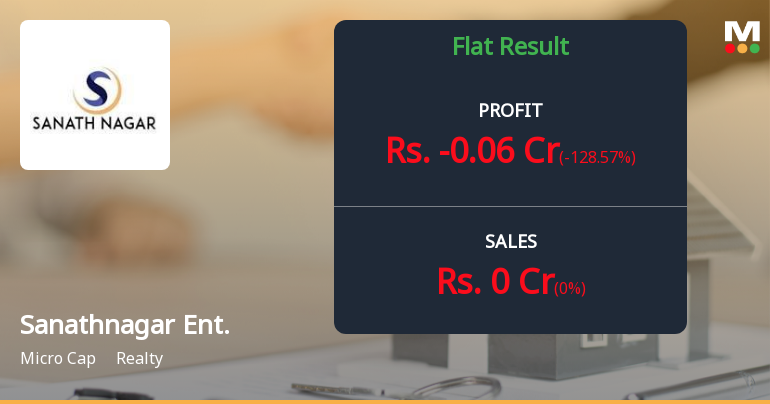
Sanathnagar Enterprises Q1 FY27: Losses Deepen as Realty Firm Struggles Without Revenue
Sanathnagar Enterprises Ltd., the erstwhile laminate manufacturer now operating as a real estate entity, reported a net loss of ₹0.06 crores for Q1 FY27, marking the continuation of a troubling operational pattern that has plagued the micro-cap company. The loss represents a 50.00% deterioration from the ₹0.04 crore loss recorded in Q1 FY26, whilst the stock price remains under severe pressure at ₹31.50, down 34.02% over the past year and trading near its 52-week low of ₹29.01.
Read full news article Announcements
Announcement under Regulation 30 (LODR)-Newspaper Publication
15-Jul-2026 | Source : BSENewspaper Publication
Intimation Under Regulation 31A Of The SEBI (Listing Obligations And Disclosure Requirements) Regulations 2015 (Listing Regulations) - Submission Of Application To Stock Exchanges For Re-Classification From Promoter Category To Public Category
15-Jul-2026 | Source : BSEIntimation under Regulation 31A of SEBI Listing Regulation for submission of application
Board Meeting Outcome for Unaudited Financial Results Of The Company For The Quarter Ended June 30 2026
14-Jul-2026 | Source : BSEUnaudited Financial Results for the Quarter ended June 30 2026 along with Limited Review Report is enclosed
Corporate Actions

No Upcoming Board Meetings

No Dividend history available

No Splits history available

No Bonus history available

No Rights history available
Quality key factors
Valuation key factors
Technicals key factors
 Technical Indicator Scale: Bearish, Mildly Bearish, Sideways, Mildly Bullish, Bullish Turned
 Shareholding Snapshot : Jun 2026
Shareholding Compare (%holding)
Promoters
None
Held by 1 Schemes (0.15%)
Held by 0 FIIs
Lodha Developers Limited (72.7%)
Alpeshbhai Rasiklal Shah (1.23%)
21.53%
Quarterly Results Snapshot (Standalone) - Jun'26 - QoQ
QoQ Growth in quarter ended Jun 2026 is 0.00% vs 0.00% in Mar 2026

QoQ Growth in quarter ended Jun 2026 is -128.57% vs 362.50% in Mar 2026
Half Yearly Results Snapshot (Standalone) - Sep'25
Growth in half year ended Sep 2025 is 0.00% vs 0.00% in Sep 2024

Growth in half year ended Sep 2025 is 99.19% vs -37,100.00% in Sep 2024
Nine Monthly Results Snapshot (Standalone) - Dec'25
YoY Growth in nine months ended Dec 2025 is 0.00% vs -100.00% in Dec 2024
YoY Growth in nine months ended Dec 2025 is 97.11% vs -445.45% in Dec 2024
Annual Results Snapshot (Standalone) - Mar'26
YoY Growth in year ended Mar 2026 is 0.00% vs -100.00% in Mar 2025
YoY Growth in year ended Mar 2026 is 102.94% vs -215.65% in Mar 2025
About Sanathnagar Enterprises Ltd

Company Coordinates


