
Compare Guj. Themis Bio. with Similar Stocks
Dashboard
High Management Efficiency with a high ROE of 29.26%
Strong ability to service debt as the company has a low Debt to EBITDA ratio of 2.14 times
Poor long term growth as Net Sales has grown by an annual rate of 12.86% and Operating profit at 10.16% over the last 5 years
Negative results in Mar 26
With ROCE of 14.1, it has a Very Expensive valuation with a 10.1 Enterprise value to Capital Employed
Majority shareholders : Promoters
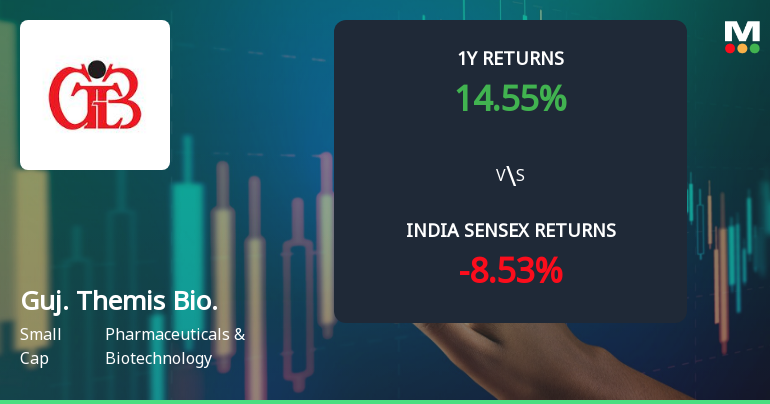
Consistent Returns over the last 3 years
Stock DNA
Pharmaceuticals & Biotechnology
INR 4,382 Cr (Small Cap)
93.00
35
0.17%
0.54
16.22%
15.03
Total Returns (Price + Dividend) 
Latest dividend: 0.67 per share ex-dividend date: Sep-04-2025
Risk Adjusted Returns v/s
Returns Beta

News
Gujarat Themis Biosyn Ltd Technical Momentum Shifts Signal Bullish Outlook
Gujarat Themis Biosyn Ltd has demonstrated a notable shift in price momentum, supported by a series of bullish technical indicators that suggest an improving outlook for this small-cap pharmaceutical player. Recent upgrades in technical grades and a 3.27% day gain underscore renewed investor interest, positioning the stock for potential further gains amid mixed sector dynamics.
Read full news article
Gujarat Themis Biosyn Ltd Technical Momentum Shifts Amid Mixed Indicator Signals
Gujarat Themis Biosyn Ltd, a small-cap player in the Pharmaceuticals & Biotechnology sector, has experienced a nuanced shift in its technical momentum, reflecting a complex interplay of bullish and bearish signals across multiple timeframes. Despite a recent downgrade in daily price performance, the company’s technical indicators reveal a cautiously optimistic outlook, prompting a reassessment of its market stance from Sell to Hold.
Read full news article
Gujarat Themis Biosyn Ltd Technical Momentum Shifts Signal Bullish Outlook
Gujarat Themis Biosyn Ltd, a small-cap player in the Pharmaceuticals & Biotechnology sector, has recently experienced a notable shift in its technical momentum, upgrading its MarketsMOJO grade from Sell to Hold as of 23 June 2026. This change reflects improving technical indicators and a cautiously optimistic outlook despite a modest day decline of 2.28% to close at ₹392.50 on 29 June 2026.
Read full news article Announcements
Announcement under Regulation 30 (LODR)-Investor Presentation
29-Jun-2026 | Source : BSEPlease refer to the attachment.
Announcement Under Regulation 30 (LODR)-Updates
26-Jun-2026 | Source : BSEPlease refer to the attachment.
Disclosures under Reg. 10(5) in respect of acquisition under Reg. 10(1)(a) of SEBI (SAST) Regulations 2011
24-Jun-2026 | Source : BSEThe Exchange has received the disclosure under Regulation 10(5) in respect of acquisition under Regulation 10(1)(a) of SEBI (Substantial Acquisition of Shares & Takeovers) Regulations 2011 for Sachin D Patel
Corporate Actions

No Upcoming Board Meetings

Gujarat Themis Biosyn Ltd has declared 67% dividend, ex-date: 04 Sep 25

Gujarat Themis Biosyn Ltd has announced 1:5 stock split, ex-date: 10 Oct 23

Gujarat Themis Biosyn Ltd has announced 1:2 bonus issue, ex-date: 09 Aug 24

No Rights history available
Quality key factors
Valuation key factors
Technicals key factors
 Technical Indicator Scale: Bearish, Mildly Bearish, Sideways, Mildly Bullish, Bullish Turned
 Shareholding Snapshot : Mar 2026
Shareholding Compare (%holding)
Promoters
5.4391
Held by 5 Schemes (1.16%)
Held by 13 FIIs (1.8%)
Pharmaceutical Business Group [india] Ltd (47.02%)
Quant Mutual Fund - Quant Manufacturing Fund (1.15%)
19.88%
Quarterly Results Snapshot (Standalone) - Mar'26 - QoQ

QoQ Growth in quarter ended Mar 2026 is 1.98% vs 2.41% in Dec 2025

QoQ Growth in quarter ended Mar 2026 is -12.60% vs -12.62% in Dec 2025
Half Yearly Results Snapshot (Standalone) - Sep'25
Growth in half year ended Sep 2025 is 6.36% vs -17.40% in Sep 2024
Growth in half year ended Sep 2025 is -1.97% vs -21.37% in Sep 2024
Nine Monthly Results Snapshot (Standalone) - Dec'25
YoY Growth in nine months ended Dec 2025 is 7.54% vs -11.54% in Dec 2024
YoY Growth in nine months ended Dec 2025 is -2.67% vs -15.04% in Dec 2024
Annual Results Snapshot (Standalone) - Mar'26
YoY Growth in year ended Mar 2026 is 9.96% vs -11.20% in Mar 2025
YoY Growth in year ended Mar 2026 is -4.29% vs -17.56% in Mar 2025
About Gujarat Themis Biosyn Ltd

Company Coordinates


