
Compare Narmada Gelatine with Similar Stocks
Dashboard
High Management Efficiency with a high ROCE of 18.70%
Company has a Debt to Equity ratio (avg) of 0.03 times
Healthy long term growth as Operating profit has grown by an annual rate 44.69%
With a growth in Operating Profit of 29.66%, the company declared Very Positive results in Mar 26
With ROE of 20.1, it has a Fair valuation with a 2.2 Price to Book Value
Stock DNA
Specialty Chemicals
INR 307 Cr (Micro Cap)
10.00
46
1.96%
0.06
20.13%
2.19
Total Returns (Price + Dividend) 
Latest dividend: 10 per share ex-dividend date: Sep-15-2025
Risk Adjusted Returns v/s
Returns Beta

News

Narmada Gelatines Ltd is Rated Strong Buy
Narmada Gelatines Ltd is rated Strong Buy by MarketsMOJO, with this rating last updated on 15 May 2026. However, the analysis and financial metrics discussed here reflect the company’s current position as of 14 July 2026, providing investors with the most recent and relevant data to assess the stock’s potential.
Read full news article
Narmada Gelatines Ltd is Rated Strong Buy
Narmada Gelatines Ltd is rated Strong Buy by MarketsMOJO, with this rating last updated on 15 May 2026. However, the analysis and financial metrics presented here reflect the company’s current position as of 03 July 2026, providing investors with the most recent and relevant data to assess the stock’s potential.
Read full news article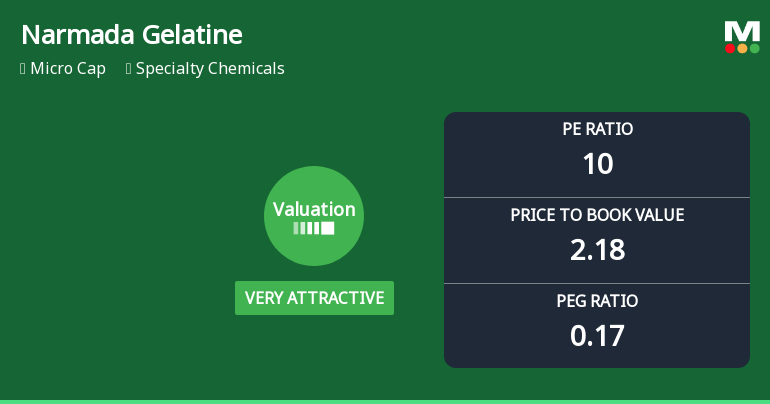
Narmada Gelatines Ltd Valuation Shifts Signal Strong Buy Opportunity
Narmada Gelatines Ltd, a micro-cap player in the specialty chemicals sector, has witnessed a significant shift in its valuation parameters, moving from a fair to a very attractive rating. With a current price of ₹508.25 and a robust Mojo Score of 87.0, upgraded recently to a Strong Buy, the company’s valuation metrics now present a compelling case for investors seeking value in a competitive industry.
Read full news article Announcements
Announcement under Regulation 30 (LODR)-Newspaper Publication
04-Jul-2026 | Source : BSENewspaper Advertisement -Notice to shareholders regarding transfer of shares to IEPF Authority which remain unclaimed for the period of seven years pursuant to the provisions of Section 124(6) of the Companies Act 2013 and rules made thereunder.
Compliances-Certificate under Reg. 74 (5) of SEBI (DP) Regulations 2018
04-Jul-2026 | Source : BSECertificate under Reg. 74(5) of SEBI (Depositories & Participants) Regulation 2018 received from M/s MUFG Intime India Private Limited the Registrar & Share Transfer Agent of the Company for the quarter ended 30th June 2026.
Closure of Trading Window
25-Jun-2026 | Source : BSEPursuant to SEBI (Prohibition of Insider Trading) Regulations 2015- Intimation closure of Trading window from 01st July 2026 till 48 hours after the Un-audited Financial Results for the quarter ended 30th June 2026 are approved by Board of Directors and made available on the website of the Stock Exchange.
Corporate Actions

No Upcoming Board Meetings

Narmada Gelatines Ltd has declared 100% dividend, ex-date: 15 Sep 25

No Splits history available

Narmada Gelatines Ltd has announced 1:2 bonus issue, ex-date: 26 Sep 14

No Rights history available
Quality key factors
Valuation key factors
Technicals key factors
 Technical Indicator Scale: Bearish, Mildly Bearish, Sideways, Mildly Bullish, Bullish Turned
 Shareholding Snapshot : Jun 2026
Shareholding Compare (%holding)
Promoters
None
Held by 0 Schemes
Held by 0 FIIs
Pioneer Jellice India Private Limited (40.06%)
None
21.88%
Quarterly Results Snapshot (Standalone) - Mar'26 - QoQ

QoQ Growth in quarter ended Mar 2026 is 8.76% vs 10.78% in Dec 2025

QoQ Growth in quarter ended Mar 2026 is 29.46% vs 14.20% in Dec 2025
Half Yearly Results Snapshot (Standalone) - Sep'25
Growth in half year ended Sep 2025 is 6.42% vs 6.90% in Sep 2024
Growth in half year ended Sep 2025 is 46.36% vs 11.54% in Sep 2024
Nine Monthly Results Snapshot (Standalone) - Dec'25
YoY Growth in nine months ended Dec 2025 is 10.46% vs 5.15% in Dec 2024
YoY Growth in nine months ended Dec 2025 is 55.74% vs 16.00% in Dec 2024
Annual Results Snapshot (Standalone) - Mar'26
YoY Growth in year ended Mar 2026 is 14.02% vs 3.92% in Mar 2025
YoY Growth in year ended Mar 2026 is 65.25% vs 12.26% in Mar 2025
About Narmada Gelatines Ltd

Company Coordinates


