
Compare Duroply Indust. with Similar Stocks
Stock DNA
Plywood Boards/ Laminates
INR 116 Cr (Micro Cap)
35.00
60
0.00%
0.44
2.11%
0.74
Total Returns (Price + Dividend) 
Duroply Indust. for the last several years.
Risk Adjusted Returns v/s
Returns Beta

News
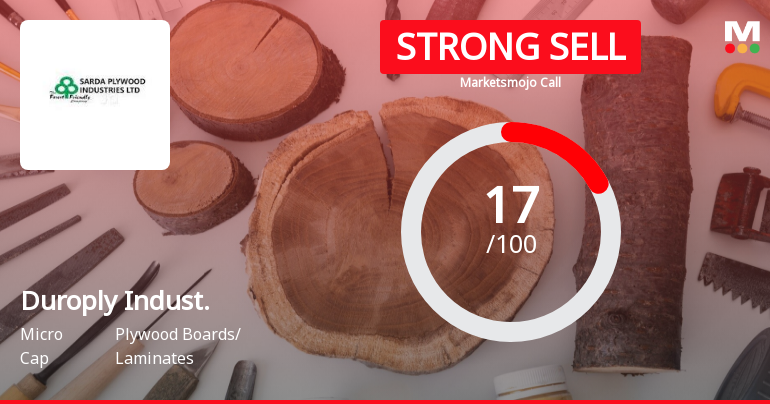
Duroply Industries Ltd is Rated Strong Sell
Duroply Industries Ltd is rated Strong Sell by MarketsMOJO, with this rating last updated on 12 May 2026. However, the analysis and financial metrics discussed here reflect the company’s current position as of 30 July 2026, providing investors with the latest insights into its performance and outlook.
Read full news article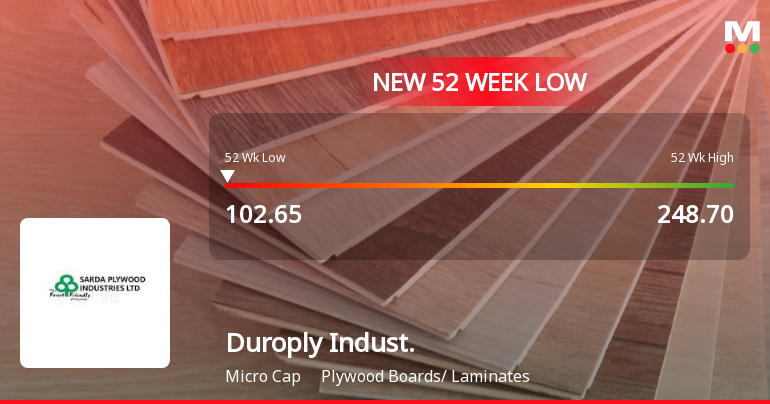
Markets Rally, But Duroply Industries Ltd Sinks to 52-Week Low in Stock-Specific Sell-Off
Despite a broadly positive market environment, Duroply Industries Ltd has plunged to a fresh 52-week low of Rs 102.65 on 24 Jul 2026, marking a steep 56.17% decline over the past year and a stark contrast to the Sensex’s relatively modest 8.00% fall. This divergence highlights the stock’s ongoing struggles amid sector headwinds and company-specific pressures.
Read full news article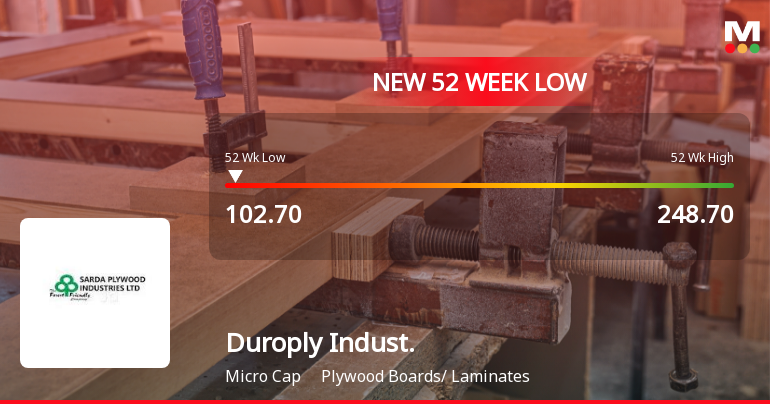
Duroply Industries Ltd Falls to 52-Week Low of Rs 102.7 as Sell-Off Deepens
For the seventh consecutive session, Duroply Industries Ltd closed lower, slipping to a fresh 52-week low of Rs 102.7 on 23 Jul 2026, marking a 56.13% decline over the past year and a stark contrast to the broader market's more modest losses.
Read full news article Announcements
Announcement under Regulation 30 (LODR)-Newspaper Publication
22-Jul-2026 | Source : BSENewspaper publication regarding special window for transfer and dematerialization (demat) of physical shares
Compliances-Certificate under Reg. 74 (5) of SEBI (DP) Regulations 2018
10-Jul-2026 | Source : BSECertificate under Regulation 74(5) of SEBI (Depositories and Participants) Regulations 2018 for the quater ended June 30 2026
Closure of Trading Window
25-Jun-2026 | Source : BSEClosure of Trading window
Corporate Actions

No Upcoming Board Meetings

Duroply Industries Ltd has declared 10% dividend, ex-date: 13 Sep 06

No Splits history available

No Bonus history available

No Rights history available
Quality key factors
Valuation key factors
Technicals key factors
 Technical Indicator Scale: Bearish, Mildly Bearish, Sideways, Mildly Bullish, Bullish Turned
 Shareholding Snapshot : Jun 2026
Shareholding Compare (%holding)
Promoters
6.7113
Held by 2 Schemes (0.08%)
Held by 0 FIIs
Poushali Sales Private Limited (11.24%)
Procheta Consultants Private Limited (6.41%)
28.36%
Quarterly Results Snapshot (Standalone) - Mar'26 - QoQ

QoQ Growth in quarter ended Mar 2026 is 19.91% vs -10.94% in Dec 2025

QoQ Growth in quarter ended Mar 2026 is -271.33% vs -40.66% in Dec 2025
Half Yearly Results Snapshot (Standalone) - Sep'25
Growth in half year ended Sep 2025 is 12.76% vs 10.35% in Sep 2024
Growth in half year ended Sep 2025 is 3.66% vs 97.93% in Sep 2024
Nine Monthly Results Snapshot (Standalone) - Dec'25
YoY Growth in nine months ended Dec 2025 is 9.66% vs 11.08% in Dec 2024
YoY Growth in nine months ended Dec 2025 is 6.94% vs 125.00% in Dec 2024
Annual Results Snapshot (Standalone) - Mar'26
YoY Growth in year ended Mar 2026 is 8.31% vs 14.96% in Mar 2025
YoY Growth in year ended Mar 2026 is -62.16% vs 669.31% in Mar 2025
About Duroply Industries Ltd

Company Coordinates


