Duroply Indust.

  • Market Cap: Micro Cap
  • Industry: Plywood Boards/ Laminates
  • ISIN: INE932D01010
  • NSEID:
  • BSEID: 516003
INR
103.80
4.1 (4.11%)
BSENSE

Sep 01, 03:30 PM

BSE+NSE Vol: 2.32 k

  • Price Points
  • Score
  • Mojo Parameters
  • Total Return
  • News and Corporate Actions
  • Key factors
  • Shareholding
  • Financials
  • CompanyCV
stock-summaryPrice Point
High/Low

1Day

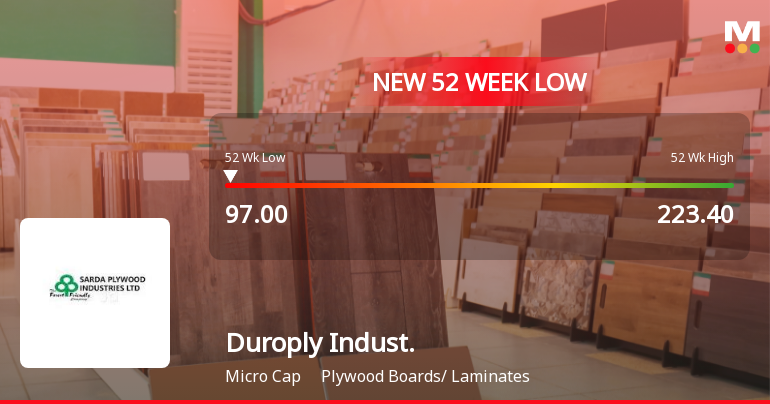
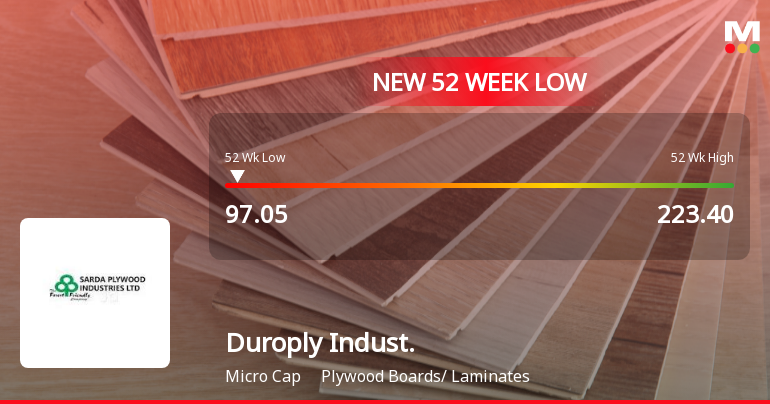
52 Week

Valuation
Technical
Day's Volume

CASH

2.32 k (-6.44%) Volume

Shareholding (Jun 2026)

FII

0.00%

Held by 0 FIIs

DII

0.10%

Held by 0 DIIs

Promoter

50.22%

Why is Duroply Industries Ltd falling/rising?

02-Sep-2026

As of 01-Sep, Duroply Industries Ltd's stock price is rising to 103.80, driven by short-term gains despite a significant year-to-date decline of 41.11% and long-term fundamental weaknesses. Investors should exercise caution due to concerns over the company's profitability and ability to service its debt.

As of 01-Sep, Duroply Industries Ltd's stock price is rising, currently at 103.80, reflecting a change of 4.1 (4.11%) upward. This increase is primarily attributed to the stock outperforming the sector by 4.97% today and opening with a gain of 5.21%. The stock also reached an intraday high of Rs 104.89, indicating strong short-term momentum.<BR><BR>Despite this positive movement, the stock has faced significant challenges over the longer term. Year-to-date, it has declined by 41.11%, and over the past year, it has generated a return of -45.24%. The company's profits have also fallen sharply by 55.5%, which raises concerns about its long-term viability. Additionally, the stock is trading at a discount compared to its peers' average historical valuations, which may attract some investors looking for value.<BR><BR>However, the overall weak long-term fundamental strength, indicated by a low average Return on Capital Employed (ROCE) of 5.90% and a poor EBIT to Interest ratio of 1.36, suggests that the company may struggle to service its debt. Furthermore, the delivery volume has decreased by 13.63% against the 5-day average, indicating a decline in investor participation.<BR><BR>In summary, while the stock is experiencing a rise in price due to short-term factors, its long-term performance and fundamental weaknesses suggest caution for investors.

View full answer

Who are in the management team of Duroply Indust.?

01-Sep-2026

The management team of Duroply Industries includes Sujit Chakravorti, Kali Kumar Chaudhuri, R L Gaggar, Probir Roy, Arun Kumar Singhania, and Suparna Chakrabortti as Independent Directors; Sudeep Chitlangia as Managing Director; Akhilesh Chitlangia as Executive Director & COO; Vinay Agarwal as Non-Executive Director; and Komal Dhruv as Company Secretary & Compliance Officer. This team combines independent oversight with executive leadership.

The management team of Duroply Industries includes the following members:<BR><BR>1. **Sujit Chakravorti** - Independent Director<BR>2. **Kali Kumar Chaudhuri** - Independent Director<BR>3. **R L Gaggar** - Independent Director<BR>4. **Sudeep Chitlangia** - Managing Director<BR>5. **Probir Roy** - Independent Director<BR>6. **Komal Dhruv** - Company Secretary & Compliance Officer<BR>7. **Akhilesh Chitlangia** - Executive Director & COO<BR>8. **Vinay Agarwal** - Non-Executive Director<BR>9. **Arun Kumar Singhania** - Independent Director<BR>10. **Suparna Chakrabortti** - Independent Director<BR><BR>This team brings a mix of independent oversight and executive leadership to the company.

View full answer

What does Duroply Indust. do?

01-Sep-2026

Duroply Industries Ltd is a micro-cap manufacturer of plywood products, including water and decorative plywood, with a market cap of INR 108 Cr. As of June 2026, it reported net sales of 100 Cr and a net profit of 1 Cr.

Overview:<BR>Duroply Industries Ltd is a manufacturer of plywood products, including water plywood and decorative plywood, operating in the plywood boards and laminates industry within the micro-cap market.<BR><BR>History:<BR>Duroply Industries Ltd was incorporated as a Private Limited Company in 1957 and became a Public Limited Company on March 30, 1974. The latest reported quarterly results indicate net sales and net profit for June 2026.<BR><BR>Financial Snapshot:<BR>Net Sales: 100 Cr (Quarterly Results - Jun 2026) <BR>Net Profit: 1 Cr (Quarterly Results - Jun 2026) <BR>Market Cap: INR 108 Cr (Micro Cap)<BR><BR>Key Metrics:<BR>P/E: 50.00 <BR>Industry P/E: 52 <BR>Dividend Yield: 0.00% <BR>Debt-Equity: 0.44 <BR>Return on Equity: 1.50% <BR>Price to Book: 0.71 <BR><BR>Contact Details:<BR>Address: 9 Parsee Church street, Kolkata West Bengal: 700001 <BR>Tel: 91-033-22652274 <BR>Email: info@sardaplywood.com <BR>Website: http://www.duroply.in

View full answer

Who are the peers of the Duroply Indust.?

01-Sep-2026

Duroply Indust.'s peers include Archidply Inds., Ecoboard Inds., Archidply Decor, Sylvan Plyboard, Airo Lam, Milton Industri., W I Plywoods, and Naman Industries. Duroply has a good growth rating but the lowest 1-year return at -48.19%, while Ecoboard Inds. leads with a 77.05% return.

Peers: The peers of Duroply Indust. are Archidply Inds., Ecoboard Inds., Archidply Decor, Sylvan Plyboard, Airo Lam, Milton Industri., W I Plywoods, and Naman Industries.<BR><BR>Quality Snapshot: Below Average management risk is observed at Archidply Inds., Ecoboard Inds., Archidply Decor, Airo Lam, and Naman Industries, while Average management risk is found at Sylvan Plyboard, Milton Industri., and W I Plywoods. Growth is rated as Good for Duroply Indust., Average for Archidply Inds. and Sylvan Plyboard, and Below Average for Ecoboard Inds., Archidply Decor, Airo Lam, Milton Industri., W I Plywoods, and Naman Industries. Capital Structure is rated as Below Average for Archidply Inds., Ecoboard Inds., Duroply Indust., Archidply Decor, Airo Lam, and Naman Industries, while Average is found at Sylvan Plyboard, Milton Industri., and W I Plywoods.<BR><BR>Return Snapshot: Ecoboard Inds. has the highest 1-year return at 77.05%, while Duroply Indust. has the lowest at -48.19%, indicating a significant underperformance compared to its peers. Additionally, Archidply Decor and Duroply Indust. have negative six-month returns.

View full answer

How big is Duroply Indust.?

01-Sep-2026

As of 31st August, Duroply Industries Ltd has a market capitalization of 108.00 Cr, with net sales of 408.75 Cr and a net profit of 2.00 Cr reported in the latest four quarters.

As of 31st August, Duroply Industries Ltd has a market capitalization of 108.00 Cr, categorizing it as a Micro Cap company.<BR><BR>In the latest four quarters, Duroply Industries Ltd reported net sales of 408.75 Cr and a net profit of 2.00 Cr.<BR><BR>The latest annual period for the balance sheet is March 2018, with shareholder's funds amounting to 43.40 Cr and total assets valued at 150.38 Cr.

View full answer

Should I buy, sell or hold Duroply Industries Ltd?

14-Aug-2026

When is the next results date for Duroply Industries Ltd?

05-Aug-2026

The next results date for Duroply Industries Ltd is 12 August 2026.

The next results date for Duroply Industries Ltd is scheduled for 12 August 2026.

View full answer

Are Duroply Industries Ltd latest results good or bad?

22-May-2026

Duroply Industries Ltd's latest Q4 FY26 results are concerning, showing a revenue growth of 4.93% but a net loss of ₹2.45 crores, a drastic decline from the previous year's profit. The significant drop in profitability and low operating margin indicate serious challenges, suggesting investors should exercise caution.

Duroply Industries Ltd's latest results for Q4 FY26 indicate a challenging financial situation. While the company achieved a revenue of ₹111.59 crores, reflecting a year-on-year growth of 4.93% and a sequential increase of 19.91%, the net profit was a significant concern. The company reported a net loss of ₹2.45 crores, which is a drastic decline of 189.74% compared to the profit of ₹2.73 crores in Q4 FY25.<BR><BR>Additionally, the operating margin fell to 4.27%, the lowest in seven quarters, indicating severe pressure on profitability. The extraordinarily high effective tax rate of 335.58% further exacerbated the situation, transforming what could have been a modest profit into a substantial loss. This anomaly raises serious questions about the company's earnings quality.<BR><BR>Overall, while revenue growth is a positive sign, the collapse in profitability and the operational challenges suggest that the results are more negative than positive. Investors should be cautious, as the stock has also underperformed significantly over the past year, down nearly 30%.

View full answer

How has been the historical performance of Duroply Indust.?

17-Nov-2025

Duroply Indust. has shown a positive historical performance with increasing net sales from INR 181.32 crore in March 2021 to INR 371.79 crore in March 2025, alongside a recovery in profitability, culminating in a profit after tax of INR 7.77 crore in March 2025. Despite rising costs, the company's operating profit improved significantly, indicating a favorable trend in revenue and profitability.

Answer:<BR>The historical performance of Duroply Indust. shows a trend of increasing net sales and profit over the years, with significant fluctuations in operating profit and net profit margins.<BR><BR>Breakdown:<BR>Duroply Indust. has experienced a steady increase in net sales from INR 181.32 crore in March 2021 to INR 371.79 crore in March 2025. The total operating income followed a similar upward trajectory, reaching INR 371.79 crore in March 2025, up from INR 190.83 crore in March 2022. However, the raw material costs and purchase of finished goods have also risen, contributing to total expenditure growth from INR 182.91 crore in March 2021 to INR 354.83 crore in March 2025. Operating profit, excluding other income, improved from a loss of INR 1.59 crore in March 2021 to a profit of INR 16.96 crore in March 2025, while profit before tax showed a positive trend, reaching INR 6.86 crore in March 2025. Profit after tax also increased significantly to INR 7.77 crore in March 2025, compared to a loss of INR 6.31 crore in March 2022. The earnings per share (EPS) reflected this growth, rising from a negative INR 9.77 in March 2022 to INR 7.87 in March 2025. Overall, while Duroply Indust. faced challenges with costs, its revenue and profitability metrics indicate a positive trend in recent years.

View full answer

Is Duroply Indust. overvalued or undervalued?

13-Nov-2025

As of November 12, 2025, Duroply Industries is considered very attractive and undervalued, with a PE ratio of 39.97, an EV to EBITDA of 14.21, and a PEG ratio of 0.76, indicating strong growth potential compared to peers like Century Plyboard and Greenply Industries, despite a year-to-date stock decline of 20.69% against the Sensex's 8.10% gain, while maintaining a robust 5-year return of 306.35%.

As of 12 November 2025, the valuation grade for Duroply Industries moved from attractive to very attractive. The company is currently assessed as undervalued. Key ratios include a PE ratio of 39.97, an EV to EBITDA of 14.21, and a PEG ratio of 0.76, which indicates strong growth potential relative to its price.<BR><BR>In comparison to its peers, Duroply's PE ratio is significantly lower than Century Plyboard's 84 and Greenply Industries' 46.54, while its EV to EBITDA is more favorable than both peers. Despite recent stock performance showing a decline of 20.69% year-to-date compared to a 8.10% gain in the Sensex, the long-term outlook remains strong, with a 5-year return of 306.35%. This suggests that Duroply Industries presents a compelling investment opportunity in the plywood boards and laminates sector.

View full answer

Who are the top shareholders of the Duroply Indust.?

17-Jul-2025

The top shareholders of Duroply Industries include Poushali Sales Private Limited with 12.36%, Tusk Investments Limited as the largest public shareholder at 4.06%, and individual investors holding 28.67%. There are no foreign institutional investors, and mutual funds hold a minimal 0.09%.

The top shareholders of Duroply Industries include the promoters, who hold a significant majority of the shares. The promoter with the highest holding is Poushali Sales Private Limited, which owns 12.36% of the company. Additionally, Tusk Investments Limited is the highest public shareholder, holding 4.06%. Individual investors collectively hold 28.67% of the shares, while mutual funds have a minimal presence with 0.09% held by two schemes. Notably, there are no foreign institutional investors (FIIs) holding shares in the company.

View full answer

What is the technical trend for Duroply Indust.?

09-Jun-2025

As of May 12, 2025, Duroply Industries is in a mildly bearish trend, with daily moving averages and monthly MACD indicating weakness, despite some short-term bullish signals from the weekly MACD and KST.

As of 12 May 2025, the technical trend for Duroply Indust. has changed from bearish to mildly bearish. The current stance is mildly bearish, driven by the daily moving averages indicating a bearish trend and the monthly MACD showing a mildly bearish signal. The weekly MACD and KST are mildly bullish, suggesting some short-term strength, but the overall trend remains weak. The Bollinger Bands on the monthly chart are also mildly bearish, reinforcing the cautious outlook. The Dow Theory indicates a mildly bearish stance on the weekly timeframe, while the monthly shows no trend. Overall, the indicators suggest a lack of strong momentum, keeping the outlook mildly bearish.

View full answer

Has Duroply Indust. declared dividend?

06-Jun-2025

Duroply Industries Ltd has declared a 10% dividend, but the dividend yield is 0% as no dividends have been paid in recent years. Despite recent declines, the company has shown strong total returns over longer periods, with a 524.85% return over the last 5 years.

Duroply Industries Ltd has declared a 10% dividend.<BR><BR>Dividend Details:<BR>- Percentage announced: 10%<BR>- Ex-date: 13 Sep 06<BR><BR>Dividend Yield: 0%<BR><BR>Total Returns by Period:<BR>In the last 6 months, Duroply Industries Ltd experienced a price return of -19.28%, with a dividend return of 0%, resulting in a total return of -19.28%.<BR><BR>Over the past year, the company had a price return of -22.98%, a dividend return of 0%, leading to a total return of -22.98%.<BR><BR>For a 2-year period, the price return was -10.6%, with no dividend return, culminating in a total return of -10.6%.<BR><BR>In the 3-year timeframe, Duroply Industries Ltd saw a price return of 73.6%, a dividend return of 0%, resulting in a total return of 73.6%.<BR><BR>Over 4 years, the price return was 229.29%, with no dividend return, leading to a total return of 229.29%.<BR><BR>Finally, in the 5-year period, the company achieved a remarkable price return of 524.85%, with a dividend return of 0%, resulting in a total return of 524.85%.<BR><BR>Overall, while Duroply Industries Ltd has declared a dividend, the dividend yield remains at 0%, indicating that there have been no dividends paid in recent years. The total returns show significant variability, with strong performance over longer periods despite recent declines.

View full answer
iScoreScore
Click here to find our call on this stock
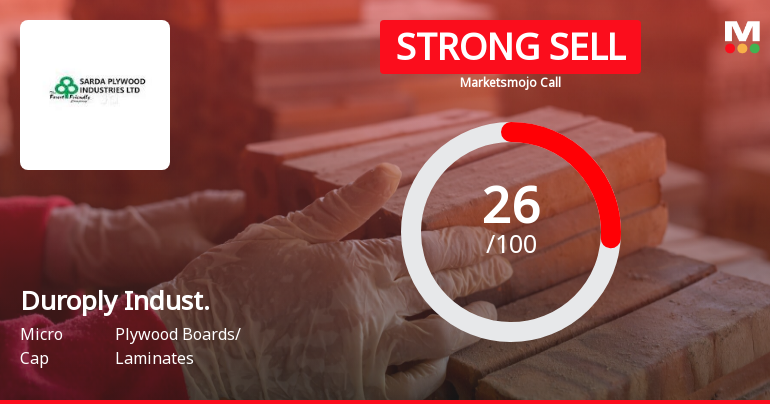
Strong Sell
Sell
Hold
Buy
Strong Buy

Dashboard

1

Weak Long Term Fundamental Strength with an average Return on Capital Employed (ROCE) of 5.90%

  • Company's ability to service its debt is weak with a poor EBIT to Interest (avg) ratio of 1.36
2

Flat results in Jun 26

3

Below par performance in long term as well as near term

stock-summaryMojo Parameters

Mojo Parameters

Loading Valuation Snapshot...

Stock DNA

stock-summary
Industry

Plywood Boards/ Laminates

stock-summary
Market cap

INR 114 Cr (Micro Cap)

stock-summary
P/E

49.00

stock-summary
Industry P/E

53

stock-summary
Dividend Yield

0.00%

stock-summary
Debt Equity

0.44

stock-summary
Return on Equity

1.50%

stock-summary
Price to Book

0.75

Revenue and Profits:
Net Sales:
100 Cr
(Quarterly Results - Jun 2026)
Net Profit:
1 Cr
stock-summaryTotal Returns
Total Returns (Price + Dividend) stock-summary
Dividend Yield (0%)
TimePeriod
Price Return
Dividend Return
Total Return
3 Months
-18.52%
0%
-18.52%
6 Months
-25.88%
0%
-25.88%
1 Year
-45.24%
0%
-45.24%
2 Years
-64.03%
0%
-64.03%
3 Years
-42.54%
0%
-42.54%
4 Years
-43.17%
0%
-43.17%
5 Years
16.5%
0%
16.5%

Duroply Indust. for the last several years.

Risk Adjusted Returns v/s stock-summary
Returns Beta
Icon
Beta has not been calculated since enough price history is not available
stock-summaryNews & Corporate Actions

Announcements stock-summary

Announcement under Regulation 30 (LODR)-Credit Rating

20-Aug-2026 | Source : BSE

Intimation of Revision of Credit Rating pursuant to Regulation 30 of SEBI (LODR) Regulation 2015

Announcement under Regulation 30 (LODR)-Earnings Call Transcript

18-Aug-2026 | Source : BSE

Please find enclosed transcript of the Earning Webinar held on Monday 17th August 2026 post declaration of Unaudited Financial Results for the quarter ended 30th June 2026

Announcement under Regulation 30 (LODR)-Analyst / Investor Meet - Outcome

17-Aug-2026 | Source : BSE

Pursuant to Regulation 30 of SEBI (Listing Obligations and Disclosure Requirements) Regulations 2015 we wish to inform you that the Audio Recording of the Earnings Webinar held on Monday 17th August 2026 at 11:00 A.M. in relation to the Unaudited Financial Results for the quarter ended June 30 2026 is made available on the website of the Company

Corporate Actions stock-summary

stock-summary
BOARD MEETING

No Upcoming Board Meetings

stock-summary
DIVIDEND

Duroply Industries Ltd has declared 10% dividend, ex-date: 13 Sep 06

stock-summary
SPLITS

No Splits history available

stock-summary
BONUS

No Bonus history available

stock-summary
RIGHTS

No Rights history available

stock-summaryKey Factors

Quality key factors stock-summary

Factor
Value
Sales Growth (5y)
15.58%
EBIT Growth (5y)
35.16%
EBIT to Interest (avg)
1.36
Debt to EBITDA (avg)
0.13
Net Debt to Equity (avg)
0.44
Sales to Capital Employed (avg)
1.80
Tax Ratio
67.32%
Dividend Payout Ratio
0
Pledged Shares
6.71%
Institutional Holding
0.10%
ROCE (avg)
5.24%
ROE (avg)
2.80%

Valuation key factors

Factor
Value
P/E Ratio
49
Industry P/E
53
Price to Book Value
0.74
EV to EBIT
13.09
EV to EBITDA
8.87
EV to Capital Employed
0.82
EV to Sales
0.44
PEG Ratio
NA
Dividend Yield
NA
ROCE (Latest)
6.83%
ROE (Latest)
1.50%

Technicals key factors

Indicator
Weekly
Monthly
MACD
Bearish
Bearish
RSI
Bullish
No Signal
Bollinger Bands
Mildly Bearish
Mildly Bearish
Moving Averages
Bearish (Daily)
KST
Bearish
Bearish
Dow Theory
Mildly Bearish
No Trend
stock-summary Technical Indicator Scale: Bearish, Mildly Bearish, Sideways, Mildly Bullish, Bullish  Turned 
stock-summaryShareholding
Shareholding Snapshot : Jun 2026stock-summary
Shareholding Compare (%holding) stock-summary
Majority shareholders

Promoters

Pledged Promoter Holdings

6.7113

Mutual Funds

Held by 2 Schemes (0.08%)

FIIs

Held by 0 FIIs

Promoter with highest holding

Poushali Sales Private Limited (11.24%)

Highest Public shareholder

Procheta Consultants Private Limited (6.41%)

Individual Investors Holdings

28.36%

stock-summaryFinancial
[
  {
    "link": "quarterly",
    "btn_text": "All Quarterly Results",
    "header": "Quarterly Results Snapshot (Standalone) - Jun'26 - QoQ",
    "rhs": [
      {
        "prefix": "Net Sales ",
        "suffix": "QoQ Growth in quarter ended Jun 2026 is -10.74% vs 19.91% in Mar 2026",
        "dir": -1
      },
      {
        "prefix": "Standalone Net Profit ",
        "suffix": "QoQ Growth in quarter ended Jun 2026 is 124.90% vs -271.33% in Mar 2026",
        "dir": 1
      }
    ],
    "table": {
      "header": [
        "Jun'26",
        "Mar'26",
        "Change(%)"
      ],
      "body": [
        {
          "field": "Net Sales",
          "val1": "99.61",
          "val2": "111.59",
          "chgp": "-10.74%",
          "chgp_class": "negative"
        },
        {
          "field": "Operating Profit (PBDIT) excl Other Income",
          "val1": "4.39",
          "val2": "4.77",
          "chgp": "-7.97%",
          "chgp_class": "negative"
        },
        {
          "field": "Interest",
          "val1": "1.99",
          "val2": "2.15",
          "chgp": "-7.44%",
          "chgp_class": "positive"
        },
        {
          "field": "Exceptional Items",
          "val1": "0.00",
          "val2": "-0.28",
          "chgp": "100.00%",
          "chgp_class": "positive"
        },
        {
          "field": "Standalone Net Profit",
          "val1": "0.61",
          "val2": "-2.45",
          "chgp": "124.90%",
          "chgp_class": "positive"
        },
        {
          "field": "Operating Profit Margin (Excl OI)",
          "val1": "4.41%",
          "val2": "4.27%",
          "chgp": "0.14%",
          "chgp_class": "positive"
        }
      ]
    }
  },
  {
    "link": "half-yearly",
    "btn_text": "All Half Yearly Results",
    "header": "Half Yearly Results Snapshot (Standalone) - Sep'25",
    "rhs": [
      {
        "prefix": "Net Sales ",
        "suffix": " Growth in half year ended Sep 2025 is 12.76% vs 10.35% in Sep 2024",
        "dir": 1
      },
      {
        "prefix": "Standalone Net Profit ",
        "suffix": " Growth in half year ended Sep 2025 is 3.66% vs 97.93% in Sep 2024",
        "dir": -1
      }
    ],
    "table": {
      "header": [
        "Sep'25",
        "Sep'24",
        "Change(%)"
      ],
      "body": [
        {
          "field": "Net Sales",
          "val1": "198.03",
          "val2": "175.62",
          "chgp": "12.76%",
          "chgp_class": "positive"
        },
        {
          "field": "Operating Profit (PBDIT) excl Other Income",
          "val1": "11.32",
          "val2": "7.60",
          "chgp": "48.95%",
          "chgp_class": "positive"
        },
        {
          "field": "Interest",
          "val1": "4.56",
          "val2": "3.49",
          "chgp": "30.66%",
          "chgp_class": "negative"
        },
        {
          "field": "Exceptional Items",
          "val1": "0.00",
          "val2": "0.00",
          "chgp": "",
          "chgp_class": "neutral"
        },
        {
          "field": "Standalone Net Profit",
          "val1": "3.96",
          "val2": "3.82",
          "chgp": "3.66%",
          "chgp_class": "positive"
        },
        {
          "field": "Operating Profit Margin (Excl OI)",
          "val1": "5.72%",
          "val2": "4.33%",
          "chgp": "1.39%",
          "chgp_class": "positive"
        }
      ]
    }
  },
  {
    "link": "nine-monthly",
    "btn_text": "All Nine Monthly Results",
    "header": "Nine Monthly Results Snapshot (Standalone) - Dec'25",
    "rhs": [
      {
        "prefix": "Net Sales ",
        "suffix": "YoY Growth in nine months ended Dec 2025 is 9.66% vs 11.08% in Dec 2024",
        "dir": -1
      },
      {
        "prefix": "Standalone Net Profit ",
        "suffix": "YoY Growth in nine months ended Dec 2025 is 6.94% vs 125.00% in Dec 2024",
        "dir": -1
      }
    ],
    "table": {
      "header": [
        "Dec'25",
        "Dec'24",
        "Change(%)"
      ],
      "body": [
        {
          "field": "Net Sales",
          "val1": "291.09",
          "val2": "265.44",
          "chgp": "9.66%",
          "chgp_class": "positive"
        },
        {
          "field": "Operating Profit (PBDIT) excl Other Income",
          "val1": "16.31",
          "val2": "11.64",
          "chgp": "40.12%",
          "chgp_class": "positive"
        },
        {
          "field": "Interest",
          "val1": "6.96",
          "val2": "5.43",
          "chgp": "28.18%",
          "chgp_class": "negative"
        },
        {
          "field": "Exceptional Items",
          "val1": "0.00",
          "val2": "0.00",
          "chgp": "",
          "chgp_class": "neutral"
        },
        {
          "field": "Standalone Net Profit",
          "val1": "5.39",
          "val2": "5.04",
          "chgp": "6.94%",
          "chgp_class": "positive"
        },
        {
          "field": "Operating Profit Margin (Excl OI)",
          "val1": "5.60%",
          "val2": "4.39%",
          "chgp": "1.21%",
          "chgp_class": "positive"
        }
      ]
    }
  },
  {
    "link": "annual",
    "btn_text": "All Annual Results",
    "header": "Annual Results Snapshot (Standalone) - Mar'26",
    "rhs": [
      {
        "prefix": "Net Sales ",
        "suffix": "YoY Growth in year ended Mar 2026 is 8.31% vs 14.96% in Mar 2025",
        "dir": -1
      },
      {
        "prefix": "Standalone Net Profit ",
        "suffix": "YoY Growth in year ended Mar 2026 is -62.16% vs 669.31% in Mar 2025",
        "dir": -1
      }
    ],
    "table": {
      "header": [
        "Mar'26",
        "Mar'25",
        "Change(%)"
      ],
      "body": [
        {
          "field": "Net Sales",
          "val1": "402.67",
          "val2": "371.79",
          "chgp": "8.31%",
          "chgp_class": "positive"
        },
        {
          "field": "Operating Profit (PBDIT) excl Other Income",
          "val1": "21.08",
          "val2": "16.96",
          "chgp": "24.29%",
          "chgp_class": "positive"
        },
        {
          "field": "Interest",
          "val1": "9.11",
          "val2": "7.41",
          "chgp": "22.94%",
          "chgp_class": "negative"
        },
        {
          "field": "Exceptional Items",
          "val1": "-0.28",
          "val2": "1.04",
          "chgp": "-126.92%",
          "chgp_class": "negative"
        },
        {
          "field": "Standalone Net Profit",
          "val1": "2.94",
          "val2": "7.77",
          "chgp": "-62.16%",
          "chgp_class": "negative"
        },
        {
          "field": "Operating Profit Margin (Excl OI)",
          "val1": "5.24%",
          "val2": "4.56%",
          "chgp": "0.68%",
          "chgp_class": "positive"
        }
      ]
    }
  }
]

Quarterly Results Snapshot (Standalone) - Jun'26 - QoQstock-summary

Jun'26
Mar'26
Change(%)
Net Sales
99.61
111.59
-10.74%
Operating Profit (PBDIT) excl Other Income
4.39
4.77
-7.97%
Interest
1.99
2.15
-7.44%
Exceptional Items
0.00
-0.28
100.00%
Standalone Net Profit
0.61
-2.45
124.90%
Operating Profit Margin (Excl OI)
4.41%
4.27%
0.14%
Values in Rs Cr.
Direction Arrows
Net Sales

QoQ Growth in quarter ended Jun 2026 is -10.74% vs 19.91% in Mar 2026

Direction Arrows
Standalone Net Profit

QoQ Growth in quarter ended Jun 2026 is 124.90% vs -271.33% in Mar 2026

Half Yearly Results Snapshot (Standalone) - Sep'25stock-summary

Sep'25
Sep'24
Change(%)
Net Sales
198.03
175.62
12.76%
Operating Profit (PBDIT) excl Other Income
11.32
7.60
48.95%
Interest
4.56
3.49
30.66%
Exceptional Items
0.00
0.00
Standalone Net Profit
3.96
3.82
3.66%
Operating Profit Margin (Excl OI)
5.72%
4.33%
1.39%
Values in Rs Cr.
Direction Arrows
Net Sales

Growth in half year ended Sep 2025 is 12.76% vs 10.35% in Sep 2024

Direction Arrows
Standalone Net Profit

Growth in half year ended Sep 2025 is 3.66% vs 97.93% in Sep 2024

Nine Monthly Results Snapshot (Standalone) - Dec'25stock-summary

Dec'25
Dec'24
Change(%)
Net Sales
291.09
265.44
9.66%
Operating Profit (PBDIT) excl Other Income
16.31
11.64
40.12%
Interest
6.96
5.43
28.18%
Exceptional Items
0.00
0.00
Standalone Net Profit
5.39
5.04
6.94%
Operating Profit Margin (Excl OI)
5.60%
4.39%
1.21%
Values in Rs Cr.
Direction Arrows
Net Sales

YoY Growth in nine months ended Dec 2025 is 9.66% vs 11.08% in Dec 2024

Direction Arrows
Standalone Net Profit

YoY Growth in nine months ended Dec 2025 is 6.94% vs 125.00% in Dec 2024

Annual Results Snapshot (Standalone) - Mar'26stock-summary

Mar'26
Mar'25
Change(%)
Net Sales
402.67
371.79
8.31%
Operating Profit (PBDIT) excl Other Income
21.08
16.96
24.29%
Interest
9.11
7.41
22.94%
Exceptional Items
-0.28
1.04
-126.92%
Standalone Net Profit
2.94
7.77
-62.16%
Operating Profit Margin (Excl OI)
5.24%
4.56%
0.68%
Values in Rs Cr.
Direction Arrows
Net Sales

YoY Growth in year ended Mar 2026 is 8.31% vs 14.96% in Mar 2025

Direction Arrows
Standalone Net Profit

YoY Growth in year ended Mar 2026 is -62.16% vs 669.31% in Mar 2025

stock-summaryCompany CV
About Duroply Industries Ltd stock-summary
stock-summary
Duroply Industries Ltd
Micro Cap
Plywood Boards/ Laminates
Duroply Industries Limited (Formerly known Sarda Plywood Industries Limited) was incorporated as a Private Limited Company on June 26, 1957 and made a Public Limited Company effective from March 30, 1974. The Company manufactures water plywood, special decorative plywood and plywood products. It diversified into manufacturing special woolpack, high-density polyethylene (HDPE) bags by setting up a 100% EOU with a buy-back agreement with Elders, Australia.
Company Coordinates stock-summary
Company Details
9 Parsee Church street , Kolkata West Bengal : 700001
stock-summary
Tel: 91-033-22652274
stock-summary
info@sardaplywood.com
Registrar Details
Maheshwari Datamatics Pvt Ltd , 6 Mangoe Lane , 2nd Floor, Calcutta