
Compare Dharani Finance with Similar Stocks
Dashboard
Weak Long Term Fundamental Strength with an average Return on Equity (ROE) of 3.51%
Flat results in Mar 26
With ROE of 5.5, it has a Attractive valuation with a 0.8 Price to Book Value
Majority shareholders : Non Institution
Market Beating performance in long term as well as near term
Stock DNA
Non Banking Financial Company (NBFC)
INR 8 Cr (Micro Cap)
15.00
21
0.00%
0.02
5.48%
0.81
Total Returns (Price + Dividend) 
Latest dividend: 0.7000 per share ex-dividend date: Sep-06-2012
Risk Adjusted Returns v/s
Returns Beta

News

Dharani Finance Ltd Upgraded to Hold as Technicals and Valuation Improve
Dharani Finance Ltd, a micro-cap player in the Non Banking Financial Company (NBFC) sector, has seen its investment rating upgraded from Sell to Hold as of 30 June 2026. This change reflects a combination of improved technical indicators, a more attractive valuation profile, and a stabilising financial trend despite recent flat quarterly results. The company’s stock has delivered robust returns over multiple time horizons, significantly outperforming the Sensex, which underpins the revised outlook.
Read full news article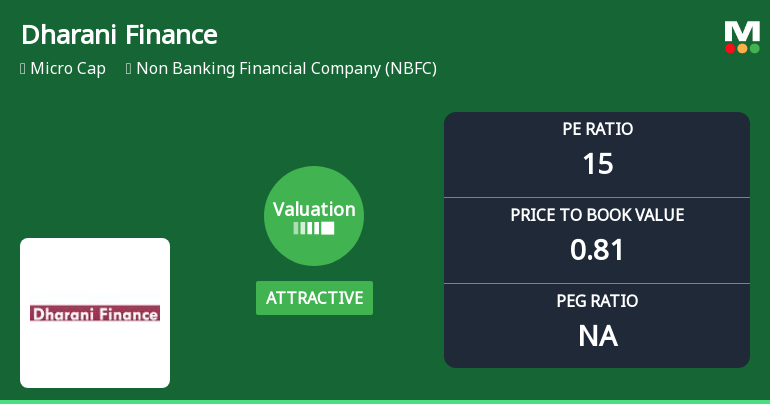
Dharani Finance Ltd Valuation Shifts Signal Renewed Price Attractiveness
Dharani Finance Ltd, a micro-cap player in the Non Banking Financial Company (NBFC) sector, has witnessed a notable shift in its valuation parameters, moving from a very attractive to an attractive grade. This change, coupled with a recent upgrade in its Mojo Grade from Sell to Hold, reflects a growing investor confidence amid robust price performance and improving fundamentals.
Read full news article
Dharani Finance Ltd Downgraded to Strong Sell Amid Weak Fundamentals and Bearish Technicals
Dharani Finance Ltd, a micro-cap player in the Non Banking Financial Company (NBFC) sector, has been downgraded from a Sell to a Strong Sell rating as of 19 May 2026. This revision reflects deteriorating technical indicators, stagnant financial performance, and a weak fundamental outlook, despite the stock’s attractive valuation metrics. The downgrade comes amid a sharp decline in share price and underperformance relative to broader market indices.
Read full news article Announcements
Closure of Trading Window
24-Jun-2026 | Source : BSEClosure of trading window for the purpose of considering the unaudited financial results for the quarter ended 30th June 2026
Announcement under Regulation 30 (LODR)-Newspaper Publication
22-May-2026 | Source : BSENewspaper Publication - Special window for transfer and dematerialization of physical securities
Announcement under Regulation 30 (LODR)-Newspaper Publication
18-May-2026 | Source : BSENewspaper publication of audited financial results for the quarter and year ended 31st March 2026
Corporate Actions

No Upcoming Board Meetings

Dharani Finance Ltd has declared 7% dividend, ex-date: 06 Sep 12

No Splits history available

No Bonus history available

No Rights history available
Quality key factors
Valuation key factors
Technicals key factors
 Technical Indicator Scale: Bearish, Mildly Bearish, Sideways, Mildly Bullish, Bullish Turned
 Shareholding Snapshot : Mar 2026
Shareholding Compare (%holding)
Non Institution
None
Held by 0 Schemes
Held by 0 FIIs
Palani Gounder Periasamy (7.09%)
Anand Mohan . (2.73%)
46.19%
Quarterly Results Snapshot (Standalone) - Mar'26 - QoQ

QoQ Growth in quarter ended Mar 2026 is -10.81% vs 12.12% in Dec 2025
QoQ Growth in quarter ended Mar 2026 is -18.75% vs 60.00% in Dec 2025
Half Yearly Results Snapshot (Standalone) - Sep'25
Growth in half year ended Sep 2025 is 13.11% vs 60.53% in Sep 2024
Growth in half year ended Sep 2025 is -38.10% vs 321.05% in Sep 2024
Nine Monthly Results Snapshot (Standalone) - Dec'25
YoY Growth in nine months ended Dec 2025 is 2.91% vs 25.61% in Dec 2024
YoY Growth in nine months ended Dec 2025 is -35.38% vs 3,350.00% in Dec 2024
Annual Results Snapshot (Standalone) - Mar'26
YoY Growth in year ended Mar 2026 is -0.71% vs 89.19% in Mar 2025
YoY Growth in year ended Mar 2026 is -34.52% vs 380.00% in Mar 2025
About Dharani Finance Ltd

Company Coordinates


