
Compare UPL with Similar Stocks
Dashboard
Company's ability to service its debt is weak with a poor EBIT to Interest (avg) ratio of 1.86
- Company's ability to service its debt is weak with a poor EBIT to Interest (avg) ratio of 1.86
- The company has been able to generate a Return on Equity (avg) of 7.56% signifying low profitability per unit of shareholders funds
Poor long term growth as Operating profit has grown by an annual rate -0.49% of over the last 5 years
Below par performance in long term as well as near term
Stock DNA
Pesticides & Agrochemicals
INR 51,542 Cr (Mid Cap)
27.00
29
0.98%
0.49
5.40%
1.48
Total Returns (Price + Dividend) 
Latest dividend: 6 per share ex-dividend date: Jul-11-2025
Risk Adjusted Returns v/s
Returns Beta

News

UPL Ltd. Technical Momentum Shifts Amid Bearish Signals and Market Underperformance
UPL Ltd., a mid-cap player in the Pesticides & Agrochemicals sector, has experienced a notable shift in its technical momentum, with key indicators signalling a bearish trend. Recent data reveals a downgrade in the company’s mojo grade from Hold to Sell, reflecting deteriorating price action and underperformance relative to the broader market benchmarks such as the Sensex.
Read full news article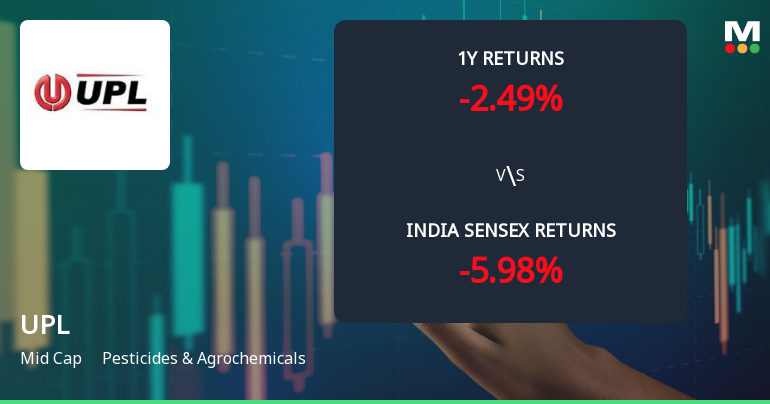
UPL Ltd. Technical Momentum Shifts Amid Mixed Indicator Signals
UPL Ltd., a key player in the Pesticides & Agrochemicals sector, has experienced a subtle shift in its technical momentum, reflecting a complex interplay of bullish and bearish signals across multiple timeframes. Despite a modest day gain of 1.11%, the stock’s broader trend remains cautiously bearish, prompting a recent downgrade in its Mojo Grade from Hold to Sell.
Read full news article
UPL Ltd. is Rated Sell by MarketsMOJO
UPL Ltd. is rated 'Sell' by MarketsMOJO, with this rating last updated on 12 May 2026. However, the analysis and financial metrics discussed here reflect the stock's current position as of 15 June 2026, providing investors with the latest insights into the company’s performance and outlook.
Read full news article Announcements
Announcement under Regulation 30 (LODR)-Acquisition
01-Jun-2026 | Source : BSEPlease find enclosed letter dated June 1 2026
Announcement under Regulation 30 (LODR)-Earnings Call Transcript
15-May-2026 | Source : BSEPlease find enclosed letter dated May 15 2026
Compliances-Reg.24(A)-Annual Secretarial Compliance
15-May-2026 | Source : BSEAnnual Secretarial Compliance Report for the year ended March 31 2026
Corporate Actions

No Upcoming Board Meetings

UPL Ltd. has declared 300% dividend, ex-date: 11 Jul 25

No Splits history available

UPL Ltd. has announced 1:2 bonus issue, ex-date: 02 Jul 19

UPL Ltd. has announced 1:8 rights issue, ex-date: 26 Nov 24
Quality key factors
Valuation key factors
Technicals key factors
 Technical Indicator Scale: Bearish, Mildly Bearish, Sideways, Mildly Bullish, Bullish Turned
 Shareholding Snapshot : Mar 2026
Shareholding Compare (%holding)
FIIs
None
Held by 40 Schemes (7.23%)
Held by 848 FIIs (41.78%)
Nerka Chemicals Pvt Ltd (21.41%)
Life Insurance Corporation Of India With Sub Accounts (4.51%)
6.58%
Quarterly Results Snapshot (Consolidated) - Mar'26 - YoY

YoY Growth in quarter ended Mar 2026 is 17.74% vs 10.62% in Mar 2025

YoY Growth in quarter ended Mar 2026 is 18.42% vs 2,140.00% in Mar 2025
Half Yearly Results Snapshot (Consolidated) - Sep'25
Growth in half year ended Sep 2025 is 5.35% vs 5.35% in Sep 2024
Growth in half year ended Sep 2025 is 156.23% vs -3,495.65% in Sep 2024
Nine Monthly Results Snapshot (Consolidated) - Dec'25
YoY Growth in nine months ended Dec 2025 is 7.85% vs 7.04% in Dec 2024
YoY Growth in nine months ended Dec 2025 is 86,000.00% vs 100.08% in Dec 2024
Annual Results Snapshot (Consolidated) - Mar'26
YoY Growth in year ended Mar 2026 is 11.15% vs 8.21% in Mar 2025
YoY Growth in year ended Mar 2026 is 114.27% vs 174.75% in Mar 2025
About UPL Ltd.

Company Coordinates


