UPL

  • Market Cap: Mid Cap
  • Industry: Pesticides & Agrochemicals
  • ISIN: INE628A01036
  • NSEID: UPL
  • BSEID: 512070
INR
571.90
-2.75 (-0.48%)
BSENSE

Aug 07, 03:30 PM

BSE+NSE Vol: 9.42 lacs

  • Price Points
  • Score
  • Mojo Parameters
  • Total Return
  • News and Corporate Actions
  • Key factors
  • Shareholding
  • Financials
  • CompanyCV
stock-summaryPrice Point
High/Low

1Day

52 Week

Valuation
Technical
Day's Volume

CASH

9.42 lacs (-72.45%) Volume

Shareholding (Jun 2026)

FII

42.39%

Held by 802 FIIs

DII

15.65%

Held by 77 DIIs

Promoter

33.51%

Why is UPL Ltd. falling/rising?

08-Aug-2026

As of 07-Aug, UPL Ltd.'s stock price is declining, currently at Rs 571.90, with an 8.5% loss over the last four days and a year-to-date decrease of 28.04%. The stock is trading near its 52-week low and below its moving averages, reflecting negative investor sentiment due to weak financial indicators and poor growth prospects.

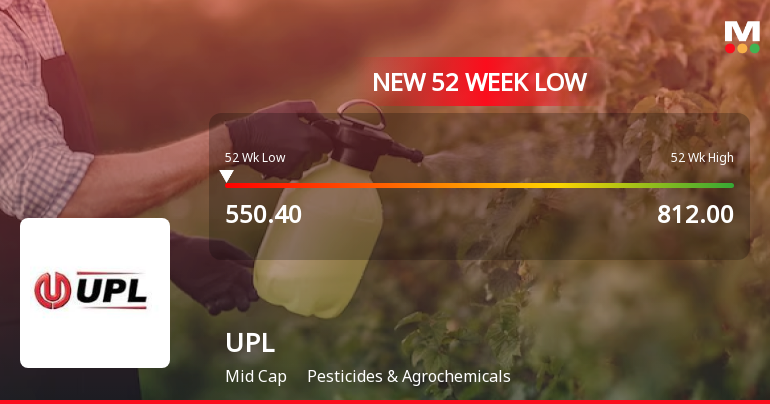
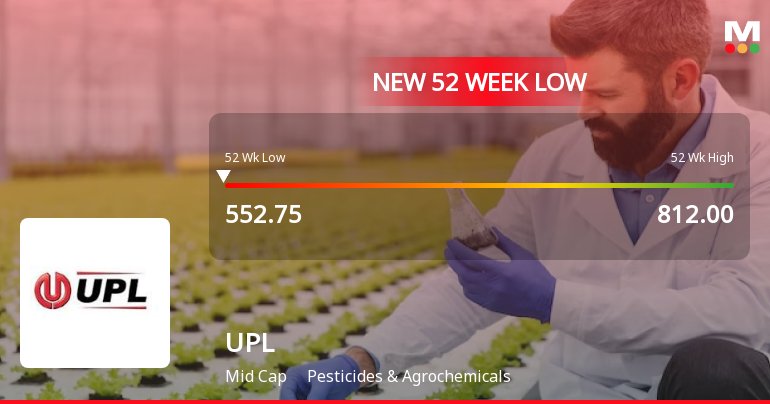
As of 07-Aug, UPL Ltd.'s stock price is falling, currently at Rs 571.90, reflecting a decrease of Rs 2.75 or 0.48%. The stock has been on a downward trend, having lost 8.5% over the last four days. This decline is further evidenced by its performance over various periods, showing a 1-week drop of 5.38%, a 1-month decline of 4.73%, and a year-to-date decrease of 28.04%. <BR><BR>The stock is also trading close to its 52-week low, just 1.51% above Rs 563.25. Additionally, UPL Ltd. is trading below its moving averages across multiple time frames, indicating a bearish trend. Despite a rise in investor participation, with delivery volume increasing by 8.21% against the 5-day average, the overall sentiment remains negative due to the company's weak financial indicators. <BR><BR>The company's ability to service its debt is concerning, with a poor EBIT to Interest ratio of 1.83, and it has shown low profitability with a Return on Equity of only 7.56%. Furthermore, the operating profit has declined at an annual rate of -0.37% over the last five years, and the recent performance has been below par, with a PAT growth of -21.10% for the nine months ending June. <BR><BR>Overall, the combination of poor short-term and long-term growth prospects, along with underperformance relative to benchmarks, contributes to the stock's current decline.

View full answer

Are UPL Ltd. latest results good or bad?

04-Aug-2026

UPL Ltd.'s latest results are concerning, showing a 99.06% drop in net profit quarter-on-quarter despite a 10.47% year-on-year revenue growth. The decline in operating margins and below-average return on equity indicate significant challenges that the company needs to address.

UPL Ltd.'s latest results present a mixed picture, reflecting both positive and negative aspects. On one hand, the company achieved a year-on-year revenue growth of 10.47%, indicating it has maintained its market share despite challenging conditions in the agrochemical sector. However, the quarterly performance shows significant operational challenges, as net profit plummeted by 99.06% quarter-on-quarter, resulting in only ₹10 crores in profit, which is concerning given the revenue of ₹10,181 crores.<BR><BR>The operating margin also saw a notable decline, dropping to 14.24% from 19.41% in the previous quarter, which raises alarms about the company's cost management and profitability. Furthermore, the return on equity (ROE) of 7.56% is below the sector average, suggesting that UPL is struggling to generate adequate returns on shareholder capital.<BR><BR>While the stock gained 3.41% following the results, it remains significantly below its 52-week high, reflecting ongoing investor skepticism. Overall, the results can be seen as bad due to the sharp decline in profitability and margins, despite some positive year-on-year growth metrics. The company faces critical challenges that need to be addressed for a more favorable outlook.

View full answer

Should I buy, sell or hold UPL Ltd.?

04-Aug-2026

When is the next results date for UPL Ltd.?

28-Jul-2026

The next results date for UPL Ltd. is August 3, 2026.

The next results date for UPL Ltd. is scheduled for August 3, 2026.

View full answer

What does UPL do?

11-Jun-2026

UPL Ltd. is a mid-cap company in the Pesticides & Agrochemicals industry, reporting net sales of ₹18,335 Cr and a net profit of ₹1,061 Cr for the quarter ending March 2026. The company has a market cap of ₹53,086 Cr and key metrics include a P/E ratio of 28.00 and a dividend yield of 0.96%.

Overview:<BR>UPL Ltd. operates in the Pesticides & Agrochemicals industry and is categorized as a Mid Cap company.<BR><BR>History:<BR>UPL Limited was incorporated in 1985, initially as 'Vishwanath Commercials Limited'. The company underwent several name changes, becoming United Phosphorus Limited in 2013 and finally UPL Limited later that same year. The latest quarterly results reported net sales and profit for the period ending March 2026.<BR><BR>Financial Snapshot:<BR>Net Sales: 18,335 Cr (Quarterly Results - Mar 2026) <BR>Net Profit: 1,061 Cr (Quarterly Results - Mar 2026) <BR>Market Cap: INR 53,086 Cr (Mid Cap)<BR><BR>Key Metrics:<BR>P/E: 28.00 <BR>Industry P/E: 29 <BR>Dividend Yield: 0.96% <BR>Debt Equity: 0.49 <BR>Return on Equity: 5.40% <BR>Price to Book: 1.52 <BR><BR>Contact Details:<BR>Address: 3-11 GIDC, Dist Valsad VAPI Gujarat : 396195 <BR>Tel: 91-260-2400717 <BR>Email: upl.investors@uniphos.com <BR>Website: http://www.uplonline.com

View full answer

How big is UPL?

11-Jun-2026

As of 10th June, UPL Ltd. has a market capitalization of 53,086.00 Cr, with net sales of 51,839.00 Cr and a net profit of 1,922.00 Cr over the latest four quarters.

As of 10th June, UPL Ltd. has a market capitalization of 53,086.00 Cr, categorizing it as a Mid Cap company.<BR><BR>In the latest four quarters, UPL reported net sales of 51,839.00 Cr and a net profit of 1,922.00 Cr.<BR><BR>The latest annual period for the balance sheet is March 2025, with shareholder's funds amounting to 29,213.00 Cr and total assets of 84,680.00 Cr.

View full answer

Who are in the management team of UPL?

11-Jun-2026

The management team of UPL includes R D Shroff (Chairman & Managing Director), Jaidev R Shroff (Global CEO), Vikram R Shroff (Vice Chairman & CEO), and several independent directors, among others, who guide the company's strategic direction and operations.

The management team of UPL includes the following key members:<BR><BR>1. **R D Shroff** - Chairman & Managing Director<BR>2. **Jaidev R Shroff** - Director & Global CEO<BR>3. **Vikram R Shroff** - Vice Chairman & CEO<BR>4. **Hardeep Singh** - Lead Independent Director<BR>5. **Vasant P Gandhi** - Independent Director<BR>6. **Sandeep Deshmukh** - Company Secretary & Compliance Officer<BR>7. **Naina Lal Kidwai** - Independent Director<BR>8. **Suresh Kumar** - Independent Director<BR>9. **Carlos Pellicer** - Director<BR>10. **Raj Tiwari** - Whole-time Director<BR>11. **Usho Rao Monari** - Independent Director<BR><BR>This team plays a crucial role in guiding the company's strategic direction and operations.

View full answer

Who are the peers of the UPL?

11-Jun-2026

UPL's peers include P I Industries, Sumitomo Chemical, Bayer CropScience, Sharda Cropchem, Dhanuka Agritech, Rallis India, NACL Industries, Bhagiradha Chemicals, Bharat Rasayan, and Insecticides India. Sharda Cropchem has the highest 1-year return at 8.56%, while UPL's return is -5.78%.

Peers: The peers of UPL are P I Industries, Sumitomo Chemi., Bayer CropSci., Sharda Cropchem, Dhanuka Agritech, Rallis India, NACL Industries, Bhagiradha Chem., Bharat Rasayan, and Insecticid.India.<BR><BR>Quality Snapshot: Excellent management risk is observed at Bayer CropSci. and Dhanuka Agritech, while Good management risk is found at UPL, P I Industries, Sumitomo Chemi., Sharda Cropchem, and the rest. Average management risk is present at Rallis India, NACL Industries, Bhagiradha Chem., and Bharat Rasayan. Growth is Excellent at Sharda Cropchem, while Below Average growth is noted for UPL, P I Industries, Sumitomo Chemi., Bayer CropSci., Dhanuka Agritech, Rallis India, NACL Industries, Bhagiradha Chem., Bharat Rasayan, and the rest. Capital Structure is Excellent at P I Industries, Sumitomo Chemi., Bayer CropSci., Sharda Cropchem, Dhanuka Agritech, Rallis India, and Bharat Rasayan, while Below Average is seen at NACL Industries and Average at Bhagiradha Chem.<BR><BR>Return Snapshot: The peer with the highest 1-year return is Sharda Cropchem at 8.56%, while the lowest is Dhanuka Agritech at -36.93%. UPL's own 1-year return is -5.78%, which is better than Dhanuka Agritech but worse than Sharda Cropchem. Additionally, the six-month return is negative for UPL, P I Industries, Dhanuka Agritech, Rallis India, and Bharat Rasayan.

View full answer

How has been the historical performance of UPL?

12-Nov-2025

UPL's historical performance shows a recovery in 2025, with net sales rising to 46,637 Cr and a profit after tax of 1,292 Cr, following a challenging 2024 marked by significant losses. Operating profit decreased to 8,086 Cr, but cash flow improved significantly to 10,151 Cr.

Answer:<BR>The historical performance of UPL shows a fluctuating trend in key financial metrics over the years leading up to March 2025.<BR><BR>Breakdown:<BR>UPL's net sales increased from 43,098.00 Cr in March 2024 to 46,637.00 Cr in March 2025, following a decline from 53,576.00 Cr in March 2023. The total operating income also reflected this trend, rising to 46,637.00 Cr in March 2025 from 43,098.00 Cr in the previous year. However, the operating profit (PBDIT) experienced a significant drop from 10,673.00 Cr in March 2023 to 8,086.00 Cr in March 2025, with a notable operating profit margin of 16.3% in March 2025 compared to 10.53% in March 2024. Profit before tax rebounded to 1,301.00 Cr in March 2025 from a loss of 1,845.00 Cr in March 2024, leading to a profit after tax of 1,292.00 Cr, a recovery from the previous year's loss of 1,636.00 Cr. The consolidated net profit for March 2025 was 897.00 Cr, a significant improvement from the loss of 1,200.00 Cr in March 2024. On the balance sheet, total liabilities slightly increased to 84,680.00 Cr in March 2025 from 83,951.00 Cr in March 2024, while total assets also rose to 84,680.00 Cr from 83,951.00 Cr. Cash flow from operating activities improved to 10,151.00 Cr in March 2025 from 2,321.00 Cr in March 2024, contributing to a net cash inflow of 3,535.00 Cr in March 2025, compared to a minor outflow of 24.00 Cr in March 2024. Overall, UPL's financial performance indicates a recovery trajectory in 2025 after a challenging 2024.

View full answer

Is UPL overvalued or undervalued?

10-Nov-2025

As of November 7, 2025, UPL is considered undervalued with a favorable PE ratio of 26.52 and strong growth potential, outperforming peers and the Sensex, which supports its attractive valuation grade.

As of 7 November 2025, UPL's valuation grade has moved from fair to attractive, indicating a positive shift in its perceived value. The company is currently assessed as undervalued, supported by a PE ratio of 26.52, an EV to EBITDA ratio of 17.74, and a PEG ratio of 0.12, which suggests strong growth potential relative to its price. <BR><BR>In comparison to its peers, UPL's valuation metrics appear favorable; for instance, P I Industries has a significantly higher PE ratio of 35.49, while Bayer CropScience stands at 34.92. This positions UPL more attractively within the Pesticides & Agrochemicals industry. Additionally, UPL has outperformed the Sensex with a year-to-date return of 48.98% compared to the Sensex's 6.50%, reinforcing the notion that the stock is currently undervalued.

View full answer

Is UPL technically bullish or bearish?

29-Oct-2025

As of 28 October 2025, UPL's technical trend is bullish with moderate strength, supported by bullish monthly MACD and Bollinger Bands, despite some mixed signals in shorter time frames.

As of 28 October 2025, the technical trend has changed from mildly bullish to bullish. The current stance is bullish with moderate strength. The weekly MACD is mildly bearish, but the monthly MACD is bullish, indicating a potential for upward momentum. Both weekly and monthly Bollinger Bands are bullish, supporting the upward trend. Daily moving averages are also bullish, reinforcing the positive outlook. The KST shows a mixed signal with weekly mildly bearish and monthly bullish readings. Overall, while there are some mixed signals in the shorter time frames, the longer-term indicators suggest a bullish trend for UPL.

View full answer

Who are the top shareholders of the UPL?

17-Jul-2025

The top shareholders of UPL include Nerka Chemicals Pvt Ltd with 21.29%, Foreign Institutional Investors holding 34.22%, and Life Insurance Corporation of India as the largest public shareholder with 7.28%. Individual investors own 7.95%, and mutual funds collectively hold 9.14%, with no pledged promoter holdings.

The top shareholders of UPL include a mix of institutional and individual investors. The largest shareholder is Nerka Chemicals Pvt Ltd, which holds 21.29% of the company. Foreign Institutional Investors (FIIs) collectively own 34.22%, making them the majority shareholders. Additionally, Life Insurance Corporation of India is the highest public shareholder with a stake of 7.28%. Mutual funds are represented by 33 schemes, holding a combined 9.14%, while individual investors account for 7.95% of the shareholding. Notably, there are no pledged promoter holdings in the company.

View full answer

What is the bonus history of the UPL?

06-Jun-2025

UPL Ltd. has issued bonuses twice: a 1:2 bonus on July 2, 2019, and a 1:1 bonus on October 29, 2008, demonstrating its commitment to rewarding shareholders.

UPL Ltd. has a history of bonus issues that includes two significant events. The latest bonus was a 1:2 issue announced with an ex-date of July 2, 2019, and the record date was July 3, 2019. Prior to that, UPL issued a 1:1 bonus on October 31, 2008, with an ex-date of October 29, 2008. This reflects UPL's approach to rewarding shareholders through bonus shares over the years.

View full answer

Has UPL declared dividend?

06-Jun-2025

Yes, UPL Ltd. has declared a 500% dividend, amounting to ₹10 per share, with an ex-date of August 3, 2023. Despite this significant declaration, the dividend yield is 0%, and total returns over various periods show a mix of performance, with a notable 54.96% total return over the last 5 years.

UPL Ltd. has declared a 500% dividend.<BR><BR>Dividend Details:<BR>- Percentage announced: 500%<BR>- Amount per share: 10<BR>- Ex-date: 03 Aug 23<BR><BR>Dividend Yield: 0%<BR><BR>Total Returns by Period:<BR>In the last 6 months, UPL Ltd. achieved a price return of 14.61% with no dividend return, resulting in a total return of 14.61%.<BR><BR>Over the past year, the company recorded a price return of 20.0% and no dividend return, leading to a total return of 20.0%.<BR><BR>In a 2-year period, UPL Ltd. experienced a price return of -7.08% and a dividend return of 1.46%, culminating in a total return of -5.62%.<BR><BR>For the 3-year period, the price return was -17.25% with a dividend return of 3.26%, resulting in a total return of -13.99%.<BR><BR>In the 4-year timeframe, the price return was -22.87% alongside a dividend return of 3.71%, leading to a total return of -19.16%.<BR><BR>Over the last 5 years, UPL Ltd. achieved a price return of 46.82% and a dividend return of 8.14%, resulting in a total return of 54.96%.<BR><BR>Overall, while UPL Ltd. has declared a significant dividend, the dividend yield remains at 0%. The total returns over various periods show a mix of positive and negative outcomes, with a notable increase in returns over the last 5 years.

View full answer
iScoreScore
Click here to find our call on this stock
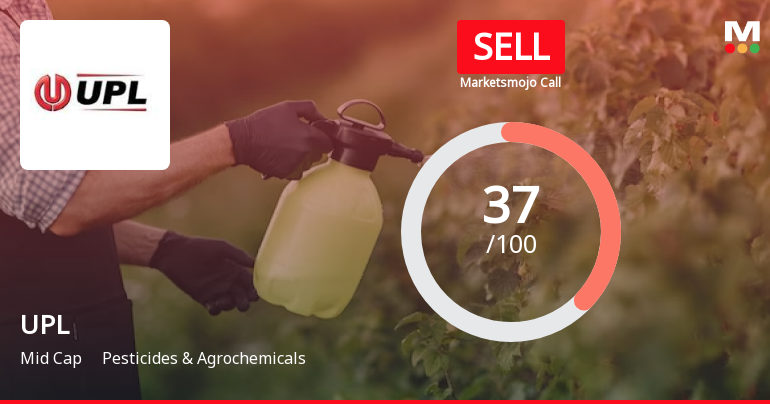
Strong Sell
Sell
Hold
Buy
Strong Buy

Dashboard

1

Company's ability to service its debt is weak with a poor EBIT to Interest (avg) ratio of 1.83

  • Company's ability to service its debt is weak with a poor EBIT to Interest (avg) ratio of 1.83
  • The company has been able to generate a Return on Equity (avg) of 7.56% signifying low profitability per unit of shareholders funds
2

Poor long term growth as Operating profit has grown by an annual rate -0.37% of over the last 5 years

 
3

Flat results in Jun 26

4

Below par performance in long term as well as near term

stock-summaryMojo Parameters

Mojo Parameters

Loading Valuation Snapshot...

Stock DNA

stock-summary
Industry

Pesticides & Agrochemicals

stock-summary
Market cap

INR 48,238 Cr (Mid Cap)

stock-summary
P/E

24.00

stock-summary
Industry P/E

27

stock-summary
Dividend Yield

1.04%

stock-summary
Debt Equity

0.49

stock-summary
Return on Equity

5.40%

stock-summary
Price to Book

1.40

Revenue and Profits:
Net Sales:
10,181 Cr
(Quarterly Results - Jun 2026)
Net Profit:
10 Cr
stock-summaryTotal Returns
Total Returns (Price + Dividend) stock-summary
Dividend Yield (1.04%)
TimePeriod
Price Return
Dividend Return
Total Return
3 Months
-12.04%
0.90%
-11.14%
6 Months
-22.83%
0.81%
-22.02%
1 Year
-18.98%
0.88%
-18.1%
2 Years
9.24%
2.23%
11.47%
3 Years
-1.75%
2.13%
0.38%
4 Years
-19.8%
3.00%
-16.8%
5 Years
-23.32%
4.32%
-19.0%

Latest dividend: 6 per share ex-dividend date: Jul-17-2026

Risk Adjusted Returns v/s stock-summary
Returns Beta
Icon
Beta has not been calculated since enough price history is not available
stock-summaryNews & Corporate Actions

News

UPL Ltd Falls 5.38%: 5 Key Factors Driving the Weekly Decline

Key Events This Week

3 Aug: Significant open interest surge amid bullish market positioning

4 Aug: Intraday low hit with heavy put option activity and flat quarterly results

5 Aug: Intensified downtrend with technical momentum shift and rating downgrade

7 Aug: Week closes at Rs.571.90 (-5.38%) despite Sensex gains

Announcements stock-summary

Shareholder Meeting / Postal Ballot-Outcome of AGM

06-Aug-2026 | Source : BSE

Please find enclosed letter dated August 6 2026

Shareholder Meeting / Postal Ballot-Scrutinizers Report

06-Aug-2026 | Source : BSE

Please find enclosed letter dated August 6 2026

Announcement under Regulation 30 (LODR)-Earnings Call Transcript

06-Aug-2026 | Source : BSE

Please find enclosed letter dated August 06 2026.

Corporate Actions stock-summary

stock-summary
BOARD MEETING

No Upcoming Board Meetings

stock-summary
DIVIDEND

UPL Ltd. has declared 300% dividend, ex-date: 17 Jul 26

stock-summary
SPLITS

No Splits history available

stock-summary
BONUS

UPL Ltd. has announced 1:2 bonus issue, ex-date: 02 Jul 19

stock-summary
RIGHTS

UPL Ltd. has announced 1:8 rights issue, ex-date: 26 Nov 24

stock-summaryKey Factors

Quality key factors stock-summary

Factor
Value
Sales Growth (5y)
6.04%
EBIT Growth (5y)
-0.37%
EBIT to Interest (avg)
1.83
Debt to EBITDA (avg)
4.01
Net Debt to Equity (avg)
0.49
Sales to Capital Employed (avg)
0.84
Tax Ratio
28.26%
Dividend Payout Ratio
26.38%
Pledged Shares
0
Institutional Holding
58.05%
ROCE (avg)
10.56%
ROE (avg)
7.56%

Valuation key factors

Factor
Value
P/E Ratio
24
Industry P/E
27
Price to Book Value
1.39
EV to EBIT
10.89
EV to EBITDA
6.98
EV to Capital Employed
1.26
EV to Sales
1.23
PEG Ratio
1.47
Dividend Yield
1.05%
ROCE (Latest)
11.69%
ROE (Latest)
5.40%

Technicals key factors

Indicator
Weekly
Monthly
MACD
Bearish
Bearish
RSI
No Signal
No Signal
Bollinger Bands
Bearish
Bearish
Moving Averages
Bearish (Daily)
KST
Mildly Bullish
Mildly Bearish
Dow Theory
Mildly Bullish
No Trend
OBV
No Trend
Mildly Bearish
stock-summary Technical Indicator Scale: Bearish, Mildly Bearish, Sideways, Mildly Bullish, Bullish  Turned 
stock-summaryShareholding
Shareholding Snapshot : Jun 2026stock-summary
Shareholding Compare (%holding) stock-summary
Majority shareholders

FIIs

Pledged Promoter Holdings

None

Mutual Funds

Held by 36 Schemes (8.57%)

FIIs

Held by 802 FIIs (42.39%)

Promoter with highest holding

Nerka Chemicals Pvt Ltd (21.41%)

Highest Public shareholder

Icici Prudential India Opportunities Fund (3.69%)

Individual Investors Holdings

6.41%

stock-summaryFinancial
[
  {
    "link": "quarterly",
    "btn_text": "All Quarterly Results",
    "header": "Quarterly Results Snapshot (Consolidated) - Jun'26 - YoY",
    "rhs": [
      {
        "prefix": "Net Sales ",
        "suffix": "YoY Growth in quarter ended Jun 2026 is 10.47% vs 1.64% in Jun 2025",
        "dir": 1
      },
      {
        "prefix": "Consolidated Net Profit ",
        "suffix": "YoY Growth in quarter ended Jun 2026 is 111.36% vs 77.08% in Jun 2025",
        "dir": 1
      }
    ],
    "table": {
      "header": [
        "Jun'26",
        "Jun'25",
        "Change(%)"
      ],
      "body": [
        {
          "field": "Net Sales",
          "val1": "10,181.00",
          "val2": "9,216.00",
          "chgp": "10.47%",
          "chgp_class": "positive"
        },
        {
          "field": "Operating Profit (PBDIT) excl Other Income",
          "val1": "1,450.00",
          "val2": "1,396.00",
          "chgp": "3.87%",
          "chgp_class": "positive"
        },
        {
          "field": "Interest",
          "val1": "852.00",
          "val2": "1,007.00",
          "chgp": "-15.39%",
          "chgp_class": "positive"
        },
        {
          "field": "Exceptional Items",
          "val1": "-9.00",
          "val2": "-9.00",
          "chgp": "",
          "chgp_class": "neutral"
        },
        {
          "field": "Consolidate Net Profit",
          "val1": "10.00",
          "val2": "-88.00",
          "chgp": "111.36%",
          "chgp_class": "positive"
        },
        {
          "field": "Operating Profit Margin (Excl OI)",
          "val1": "14.24%",
          "val2": "15.15%",
          "chgp": "-0.91%",
          "chgp_class": "negative"
        }
      ]
    }
  },
  {
    "link": "half-yearly",
    "btn_text": "All Half Yearly Results",
    "header": "Half Yearly Results Snapshot (Consolidated) - Sep'25",
    "rhs": [
      {
        "prefix": "Net Sales ",
        "suffix": " Growth in half year ended Sep 2025 is 5.35% vs 5.35% in Sep 2024",
        "dir": 0
      },
      {
        "prefix": "Consolidated Net Profit ",
        "suffix": " Growth in half year ended Sep 2025 is 156.23% vs -3,495.65% in Sep 2024",
        "dir": 1
      }
    ],
    "table": {
      "header": [
        "Sep'25",
        "Sep'24",
        "Change(%)"
      ],
      "body": [
        {
          "field": "Net Sales",
          "val1": "21,235.00",
          "val2": "20,157.00",
          "chgp": "5.35%",
          "chgp_class": "positive"
        },
        {
          "field": "Operating Profit (PBDIT) excl Other Income",
          "val1": "3,397.00",
          "val2": "2,453.00",
          "chgp": "38.48%",
          "chgp_class": "positive"
        },
        {
          "field": "Interest",
          "val1": "1,791.00",
          "val2": "1,983.00",
          "chgp": "-9.68%",
          "chgp_class": "positive"
        },
        {
          "field": "Exceptional Items",
          "val1": "133.00",
          "val2": "-57.00",
          "chgp": "333.33%",
          "chgp_class": "positive"
        },
        {
          "field": "Consolidate Net Profit",
          "val1": "465.00",
          "val2": "-827.00",
          "chgp": "156.23%",
          "chgp_class": "positive"
        },
        {
          "field": "Operating Profit Margin (Excl OI)",
          "val1": "16.00%",
          "val2": "12.17%",
          "chgp": "3.83%",
          "chgp_class": "positive"
        }
      ]
    }
  },
  {
    "link": "nine-monthly",
    "btn_text": "All Nine Monthly Results",
    "header": "Nine Monthly Results Snapshot (Consolidated) - Dec'25",
    "rhs": [
      {
        "prefix": "Net Sales ",
        "suffix": "YoY Growth in nine months ended Dec 2025 is 7.85% vs 7.04% in Dec 2024",
        "dir": 1
      },
      {
        "prefix": "Consolidated Net Profit ",
        "suffix": "YoY Growth in nine months ended Dec 2025 is 86,000.00% vs 100.08% in Dec 2024",
        "dir": 1
      }
    ],
    "table": {
      "header": [
        "Dec'25",
        "Dec'24",
        "Change(%)"
      ],
      "body": [
        {
          "field": "Net Sales",
          "val1": "33,504.00",
          "val2": "31,064.00",
          "chgp": "7.85%",
          "chgp_class": "positive"
        },
        {
          "field": "Operating Profit (PBDIT) excl Other Income",
          "val1": "5,714.00",
          "val2": "4,409.00",
          "chgp": "29.60%",
          "chgp_class": "positive"
        },
        {
          "field": "Interest",
          "val1": "2,565.00",
          "val2": "2,713.00",
          "chgp": "-5.46%",
          "chgp_class": "positive"
        },
        {
          "field": "Exceptional Items",
          "val1": "77.00",
          "val2": "-133.00",
          "chgp": "157.89%",
          "chgp_class": "positive"
        },
        {
          "field": "Consolidate Net Profit",
          "val1": "861.00",
          "val2": "1.00",
          "chgp": "86,000.00%",
          "chgp_class": "positive"
        },
        {
          "field": "Operating Profit Margin (Excl OI)",
          "val1": "17.05%",
          "val2": "14.19%",
          "chgp": "2.86%",
          "chgp_class": "positive"
        }
      ]
    }
  },
  {
    "link": "annual",
    "btn_text": "All Annual Results",
    "header": "Annual Results Snapshot (Consolidated) - Mar'26",
    "rhs": [
      {
        "prefix": "Net Sales ",
        "suffix": "YoY Growth in year ended Mar 2026 is 11.15% vs 8.21% in Mar 2025",
        "dir": 1
      },
      {
        "prefix": "Consolidated Net Profit ",
        "suffix": "YoY Growth in year ended Mar 2026 is 114.27% vs 174.75% in Mar 2025",
        "dir": -1
      }
    ],
    "table": {
      "header": [
        "Mar'26",
        "Mar'25",
        "Change(%)"
      ],
      "body": [
        {
          "field": "Net Sales",
          "val1": "51,839.00",
          "val2": "46,637.00",
          "chgp": "11.15%",
          "chgp_class": "positive"
        },
        {
          "field": "Operating Profit (PBDIT) excl Other Income",
          "val1": "9,272.00",
          "val2": "7,600.00",
          "chgp": "22.00%",
          "chgp_class": "positive"
        },
        {
          "field": "Interest",
          "val1": "3,401.00",
          "val2": "3,627.00",
          "chgp": "-6.23%",
          "chgp_class": "positive"
        },
        {
          "field": "Exceptional Items",
          "val1": "61.00",
          "val2": "-408.00",
          "chgp": "114.95%",
          "chgp_class": "positive"
        },
        {
          "field": "Consolidate Net Profit",
          "val1": "1,922.00",
          "val2": "897.00",
          "chgp": "114.27%",
          "chgp_class": "positive"
        },
        {
          "field": "Operating Profit Margin (Excl OI)",
          "val1": "17.89%",
          "val2": "16.30%",
          "chgp": "1.59%",
          "chgp_class": "positive"
        }
      ]
    }
  }
]

Quarterly Results Snapshot (Consolidated) - Jun'26 - YoYstock-summary

Jun'26
Jun'25
Change(%)
Net Sales
10,181.00
9,216.00
10.47%
Operating Profit (PBDIT) excl Other Income
1,450.00
1,396.00
3.87%
Interest
852.00
1,007.00
-15.39%
Exceptional Items
-9.00
-9.00
Consolidate Net Profit
10.00
-88.00
111.36%
Operating Profit Margin (Excl OI)
14.24%
15.15%
-0.91%
Values in Rs Cr.
Direction Arrows
Net Sales

YoY Growth in quarter ended Jun 2026 is 10.47% vs 1.64% in Jun 2025

Direction Arrows
Consolidated Net Profit

YoY Growth in quarter ended Jun 2026 is 111.36% vs 77.08% in Jun 2025

Half Yearly Results Snapshot (Consolidated) - Sep'25stock-summary

Sep'25
Sep'24
Change(%)
Net Sales
21,235.00
20,157.00
5.35%
Operating Profit (PBDIT) excl Other Income
3,397.00
2,453.00
38.48%
Interest
1,791.00
1,983.00
-9.68%
Exceptional Items
133.00
-57.00
333.33%
Consolidate Net Profit
465.00
-827.00
156.23%
Operating Profit Margin (Excl OI)
16.00%
12.17%
3.83%
Values in Rs Cr.
Net Sales

Growth in half year ended Sep 2025 is 5.35% vs 5.35% in Sep 2024

Direction Arrows
Consolidated Net Profit

Growth in half year ended Sep 2025 is 156.23% vs -3,495.65% in Sep 2024

Nine Monthly Results Snapshot (Consolidated) - Dec'25stock-summary

Dec'25
Dec'24
Change(%)
Net Sales
33,504.00
31,064.00
7.85%
Operating Profit (PBDIT) excl Other Income
5,714.00
4,409.00
29.60%
Interest
2,565.00
2,713.00
-5.46%
Exceptional Items
77.00
-133.00
157.89%
Consolidate Net Profit
861.00
1.00
86,000.00%
Operating Profit Margin (Excl OI)
17.05%
14.19%
2.86%
Values in Rs Cr.
Direction Arrows
Net Sales

YoY Growth in nine months ended Dec 2025 is 7.85% vs 7.04% in Dec 2024

Direction Arrows
Consolidated Net Profit

YoY Growth in nine months ended Dec 2025 is 86,000.00% vs 100.08% in Dec 2024

Annual Results Snapshot (Consolidated) - Mar'26stock-summary

Mar'26
Mar'25
Change(%)
Net Sales
51,839.00
46,637.00
11.15%
Operating Profit (PBDIT) excl Other Income
9,272.00
7,600.00
22.00%
Interest
3,401.00
3,627.00
-6.23%
Exceptional Items
61.00
-408.00
114.95%
Consolidate Net Profit
1,922.00
897.00
114.27%
Operating Profit Margin (Excl OI)
17.89%
16.30%
1.59%
Values in Rs Cr.
Direction Arrows
Net Sales

YoY Growth in year ended Mar 2026 is 11.15% vs 8.21% in Mar 2025

Direction Arrows
Consolidated Net Profit

YoY Growth in year ended Mar 2026 is 114.27% vs 174.75% in Mar 2025

stock-summaryCompany CV
About UPL Ltd. stock-summary
stock-summary
UPL Ltd.
Mid Cap
Pesticides & Agrochemicals
UPL Limited was initially incorporated as 'Vishwanath Commercials Limited' on January 2, 1985. The Company's name was changed from Vishwanath Commercials Limited to Search Chem Industries Limited on 24 February, 1985. Again, the name of the Company was changed from Search Chem Industries Limited to United Phosphorus Limited on 30 September, 2013 and subsequently was changed to UPL Limited on 23 October, 2013. UPL Limited is a global generic crop protection, chemicals and seeds company.
Company Coordinates stock-summary
Company Details
3-11 GIDC, Dist Valsad VAPI Gujarat : 396195
stock-summary
Tel: 91-260-2400717
stock-summary
upl.investors@uniphos.com
Registrar Details
Link Intime India Pvt Ltd, C-13 Pannalal Silk Compound, L B S Marg, Bhandup , Mumbai