
Compare A2Z Infra Engg. with Similar Stocks
Dashboard
With a Operating Losses, the company has a Weak Long Term Fundamental Strength
- Poor long term growth as Net Sales has grown by an annual rate of -1.41% over the last 5 years
- High Debt Company with a Debt to Equity ratio (avg) of 3.39 times
- The company has been able to generate a Return on Equity (avg) of 4.27% signifying low profitability per unit of shareholders funds
Flat results in Dec 25
99.68% of Promoter Shares are Pledged
Underperformed the market in the last 1 year
Total Returns (Price + Dividend) 
Latest dividend: 2 per share ex-dividend date: Sep-22-2011
Risk Adjusted Returns v/s
Returns Beta

News
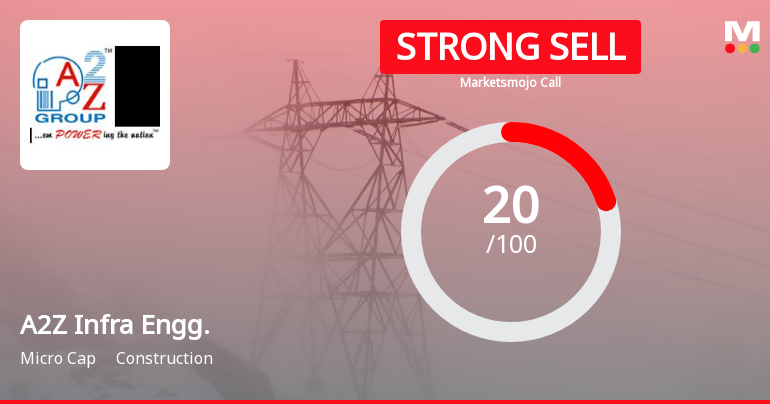
A2Z Infra Engineering Ltd is Rated Strong Sell
A2Z Infra Engineering Ltd is rated Strong Sell by MarketsMOJO, with this rating last updated on 17 Nov 2025. However, the analysis and financial metrics discussed here reflect the stock’s current position as of 22 June 2026, providing investors with an up-to-date view of the company’s fundamentals, returns, and market standing.
Read full news article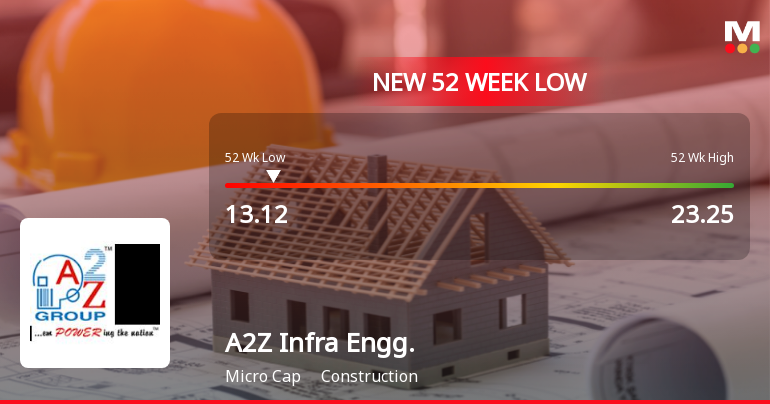
A2Z Infra Engineering Ltd Falls to 52-Week Low of Rs 13.12 as Sell-Off Deepens
For the third consecutive session, A2Z Infra Engineering Ltd has declined, culminating in a fresh 52-week low of Rs 13.12 on 12 Jun 2026. This drop comes despite a broader market rally, highlighting stock-specific pressures that continue to weigh on the micro-cap construction firm.
Read full news article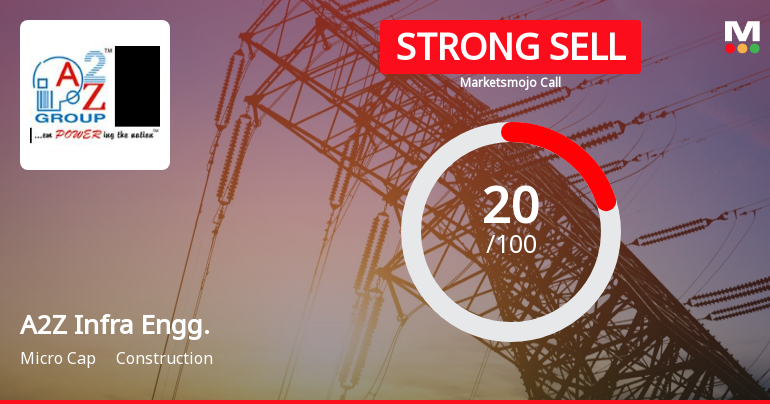
A2Z Infra Engineering Ltd is Rated Strong Sell
A2Z Infra Engineering Ltd is rated 'Strong Sell' by MarketsMOJO, with this rating last updated on 17 Nov 2025. However, the analysis and financial metrics presented here reflect the stock's current position as of 11 June 2026, providing investors with an up-to-date view of the company’s fundamentals, valuation, financial trend, and technical outlook.
Read full news article Announcements
Board Meeting Intimation for Approval Of Audited Standalone & Consolidated Financial Results For The Quarter (Q4) And Financial Year Ended March 31 2026
20-Jun-2026 | Source : BSEA2Z Infra Engineering Ltdhas informed BSE that the meeting of the Board of Directors of the Company is scheduled on 29/06/2026 inter alia to consider and approve Audited Standalone & Consolidated Financial Results for the Quarter (Q4) and Financial Year ended March 31 2026
Announcement under Regulation 30 (LODR)-Newspaper Publication
17-Jun-2026 | Source : BSECopy of Newspaper Publication
Results-Delay in Financial Results
28-May-2026 | Source : BSEUpdate on Intimation dated May 22 2026 regarding meeting of Board of Directors of the Company scheduled to be held on May 29 2026 for considering & approving Audited Standalone & Consolidated Financial Results for the Quarter (Q4) and Year ended March 31 2026.
Corporate Actions

No Upcoming Board Meetings

A2Z Infra Engineering Ltd has declared 20% dividend, ex-date: 22 Sep 11

No Splits history available

No Bonus history available

No Rights history available
Quality key factors
Valuation key factors
Technicals key factors
 Technical Indicator Scale: Bearish, Mildly Bearish, Sideways, Mildly Bullish, Bullish Turned
 Shareholding Snapshot : Mar 2026
Shareholding Compare (%holding)
Non Institution
99.6798
Held by 0 Schemes
Held by 3 FIIs (0.86%)
Amit Mittal (15.53%)
Jane Sequeira Pinto (4.06%)
58.18%
Quarterly Results Snapshot (Consolidated) - Dec'25 - QoQ

QoQ Growth in quarter ended Dec 2025 is 15.04% vs 4.65% in Sep 2025
QoQ Growth in quarter ended Dec 2025 is 63.01% vs -330.67% in Sep 2025
Half Yearly Results Snapshot (Consolidated) - Sep'25
Growth in half year ended Sep 2025 is 15.01% vs -17.86% in Sep 2024

Growth in half year ended Sep 2025 is -118.05% vs 279.80% in Sep 2024
Nine Monthly Results Snapshot (Consolidated) - Dec'25
YoY Growth in nine months ended Dec 2025 is 19.78% vs -15.46% in Dec 2024
YoY Growth in nine months ended Dec 2025 is -132.60% vs 210.94% in Dec 2024
Annual Results Snapshot (Consolidated) - Mar'25
YoY Growth in year ended Mar 2025 is -13.44% vs 11.18% in Mar 2024
YoY Growth in year ended Mar 2025 is 257.64% vs 95.37% in Mar 2024
About A2Z Infra Engineering Ltd

Company Coordinates


