
Compare Chavda Infra Ltd with Similar Stocks
Dashboard
Healthy long term growth as Net Sales has grown by an annual rate of 30.70% and Operating profit at 40.72%
- PBT LESS OI(Q) At Rs 10.55 cr has Grown at 56.8% (vs previous 4Q average)
- NET SALES(Q) Highest at Rs 167.61 cr
- PAT(Q) At Rs 7.34 cr has Grown at 36.7% (vs previous 4Q average)
With ROCE of 11.8, it has a Very Attractive valuation with a 1.2 Enterprise value to Capital Employed
Below par performance in long term as well as near term
Total Returns (Price + Dividend) 
Chavda Infra Ltd for the last several years.
Risk Adjusted Returns v/s
Returns Beta

News
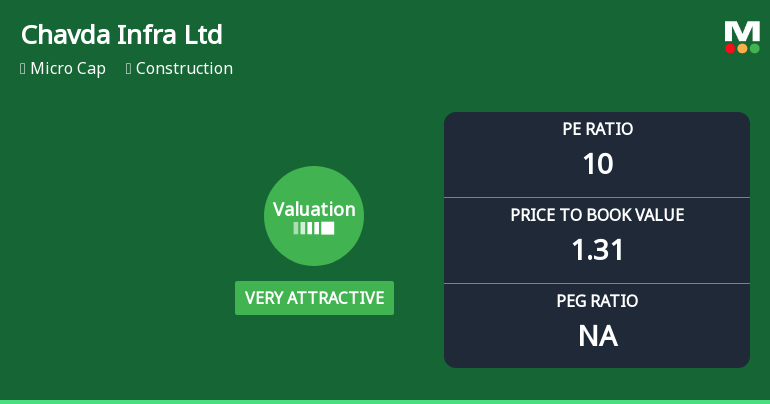
Chavda Infra Ltd Valuation Shifts to Very Attractive Amid Market Challenges
Chavda Infra Ltd has seen a notable shift in its valuation parameters, moving from an attractive to a very attractive rating, despite ongoing headwinds in the construction sector and a challenging market environment. This re-rating reflects improved price-to-earnings and price-to-book value metrics relative to its historical averages and peer group, signalling a potential opportunity for investors seeking value in the micro-cap construction space.
Read full news article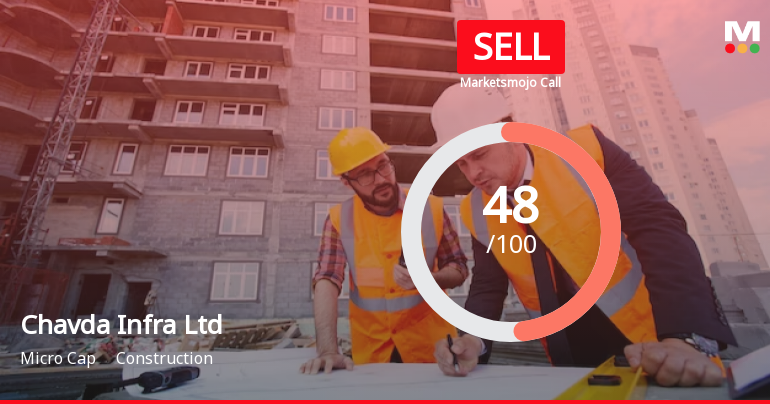
Chavda Infra Ltd is Rated Sell
Chavda Infra Ltd is rated 'Sell' by MarketsMOJO, with this rating last updated on 30 May 2026. However, the analysis and financial metrics discussed below reflect the stock’s current position as of 02 June 2026, providing investors with the most up-to-date view of the company’s fundamentals, returns, and market standing.
Read full news article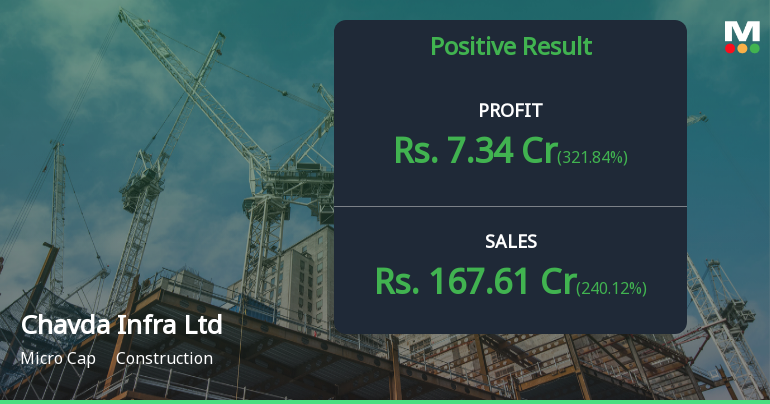
Chavda Infra Q4 FY26: Revenue Surge Masks Margin Erosion Concerns
Chavda Infra Ltd., a micro-cap construction company with a market capitalisation of ₹305.00 crores, reported a mixed performance for Q4 FY26, with net profit declining 31.73% quarter-on-quarter to ₹7.34 crores despite a dramatic 240.12% surge in revenue to ₹167.61 crores. The stock has responded negatively to the results, trading at ₹90.15 as of June 01, 2026, down 3.58% from the previous close of ₹93.50, reflecting investor concerns over deteriorating profitability metrics despite the topline expansion.
Read full news article Announcements
Corporate Actions

No Upcoming Board Meetings

No Dividend history available

No Splits history available

No Bonus history available

No Rights history available
Quality key factors
Valuation key factors
Technicals key factors
 Technical Indicator Scale: Bearish, Mildly Bearish, Sideways, Mildly Bullish, Bullish Turned
 Shareholding Snapshot : Mar 2026
Shareholding Compare (%holding)
Promoters
None
Held by 0 Schemes
Held by 0 FIIs
Maheshkumar Gunvantlal Chavda (36.75%)
Apurva Jain (4.72%)
40.26%
Quarterly Results Snapshot (Standalone) - Mar'26 - QoQ

QoQ Growth in quarter ended Mar 2026 is 240.12% vs -52.50% in Dec 2025
QoQ Growth in quarter ended Mar 2026 is 321.84% vs -78.03% in Dec 2025
Half Yearly Results Snapshot (Standalone) - Sep'25

Growth in half year ended Sep 2025 is -29.21% vs 27.56% in Mar 2025
Growth in half year ended Sep 2025 is -32.94% vs 27.13% in Mar 2025
Nine Monthly Results Snapshot (Standalone) - Dec'25
YoY Growth in nine months ended Dec 2025 is -45.83% vs 4.55% in Mar 2026
YoY Growth in nine months ended Dec 2025 is -41.91% vs 18.96% in Mar 2026
Annual Results Snapshot (Standalone) - Mar'26
YoY Growth in year ended Mar 2026 is 22.65% vs 8.18% in Mar 2025
YoY Growth in year ended Mar 2026 is -19.43% vs 12.47% in Mar 2025
About Chavda Infra Ltd

Company Coordinates


