
Compare Sunil Industries with Similar Stocks
Stock DNA
Trading & Distributors
INR 34 Cr (Micro Cap)
8.00
15
0.00%
0.93
9.34%
0.70
Total Returns (Price + Dividend) 
Sunil Industries for the last several years.
Risk Adjusted Returns v/s
Returns Beta

News

Sunil Industries Ltd Upgraded to Sell on Improved Technicals and Valuation
Sunil Industries Ltd, a micro-cap player in the Trading & Distributors sector, has seen its investment rating upgraded from Strong Sell to Sell as of 24 July 2026. This change reflects a nuanced shift across four key parameters: quality, valuation, financial trend, and technicals. Despite recent price declines, the company’s improved technical indicators and very attractive valuation metrics have prompted a more favourable outlook, though fundamental challenges remain.
Read full news article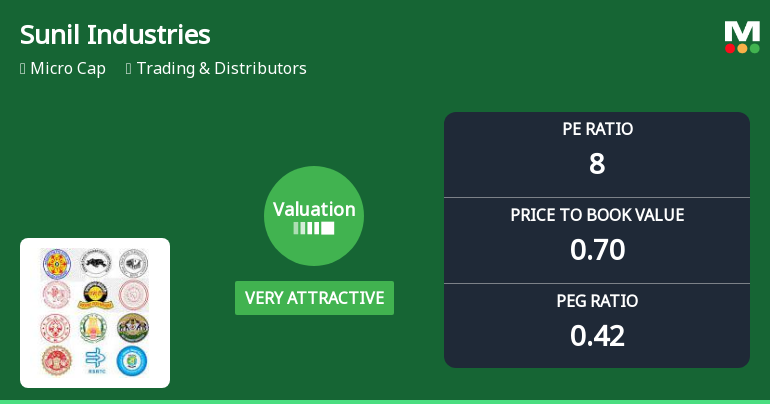
Sunil Industries Ltd Valuation Shifts Signal Renewed Price Attractiveness
Sunil Industries Ltd, a micro-cap player in the Trading & Distributors sector, has seen a marked shift in its valuation parameters, moving from a risky to a very attractive valuation grade. Despite a recent 4.99% decline in its share price to ₹82.18, the company’s price-to-earnings (P/E) and price-to-book value (P/BV) ratios now present compelling entry points compared to both historical levels and peer averages.
Read full news article
Sunil Industries Ltd is Rated Strong Sell
Sunil Industries Ltd is rated Strong Sell by MarketsMOJO, with this rating last updated on 23 June 2026. However, the analysis and financial metrics discussed here reflect the stock’s current position as of 23 July 2026, providing investors with the latest insights into the company’s fundamentals, valuation, financial trends, and technical outlook.
Read full news article Announcements
Certificate Under Reg. 74 (5) Of SEBI (DP) Regulations 2018
08-Jul-2026 | Source : BSECertificate Under Regulation 74(5) of SEBI (Depositories and Participants) Regulations 2018 for the quarter ended 30th June 2026.
Announcement under Regulation 30 (LODR)-Change in Management
26-Jun-2026 | Source : BSEIntimation relating to appointment of Ms. Shruti Somani as Non-Executive Independent Director of the Company in the Meeting of Board dated 26th June 2026.
Board Meeting Outcome for Outcome Of The Board Meeting Dated 26Th June 2026.
26-Jun-2026 | Source : BSEOutcome of Board Meeting held on Friday June 26 2026 pursuant to Regulation 30 of the SEBI (Listing Obligations and Disclosure Requirements) Regulations 2015.
Corporate Actions

No Upcoming Board Meetings

No Dividend history available

No Splits history available

No Bonus history available

No Rights history available
Quality key factors
Valuation key factors
Technicals key factors
 Technical Indicator Scale: Bearish, Mildly Bearish, Sideways, Mildly Bullish, Bullish Turned
 Shareholding Snapshot : Jun 2026
Shareholding Compare (%holding)
Promoters
None
Held by 2 Schemes (0.11%)
Held by 0 FIIs
Sunil Exim Pvt Ltd (8.21%)
Mahendra Girdharilal (4.37%)
33.2%
Quarterly Results Snapshot (Standalone) - Mar'26 - QoQ

QoQ Growth in quarter ended Mar 2026 is 269.22% vs -70.47% in Dec 2025
QoQ Growth in quarter ended Mar 2026 is 176.19% vs -84.78% in Dec 2025
Half Yearly Results Snapshot (Standalone) - Sep'25
Growth in half year ended Sep 2025 is 89.85% vs -32.91% in Sep 2024
Growth in half year ended Sep 2025 is 144.23% vs -1.89% in Sep 2024
Nine Monthly Results Snapshot (Standalone) - Dec'25
YoY Growth in nine months ended Dec 2025 is 18.61% vs -15.66% in Dec 2024
YoY Growth in nine months ended Dec 2025 is 43.57% vs 25.56% in Dec 2024
Annual Results Snapshot (Standalone) - Mar'26
YoY Growth in year ended Mar 2026 is 31.54% vs -4.64% in Mar 2025

YoY Growth in year ended Mar 2026 is 17.95% vs 74.11% in Mar 2025
About Sunil Industries Ltd

Company Coordinates


