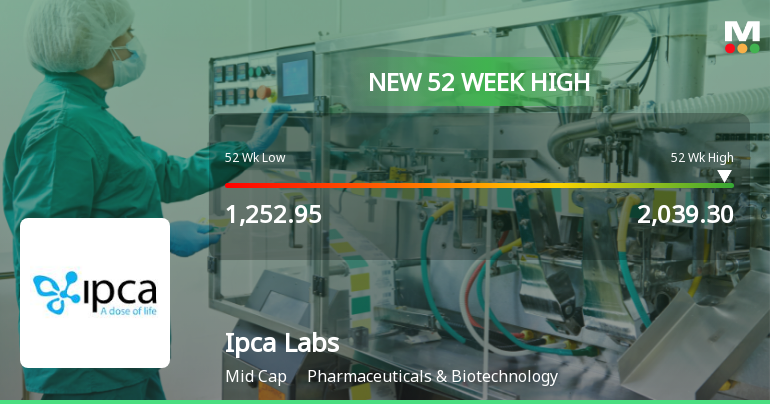
Ipca Labs

  • Market Cap: Mid Cap
  • Industry: Pharmaceuticals & Biotechnology
  • ISIN: INE571A01038
  • NSEID: IPCALAB
  • BSEID: 524494
INR
1,728.00
-68.6 (-3.82%)
BSENSE

Aug 14, 04:01 PM

BSE+NSE Vol: 4.51 lacs

  • Price Points
  • Score
  • Mojo Parameters
  • Total Return
  • News and Corporate Actions
  • Key factors
  • Shareholding
  • Financials
  • CompanyCV
stock-summaryPrice Point
High/Low

1Day

52 Week

Valuation
Technical
Day's Volume

CASH

4.51 lacs (-28.28%) Volume

Shareholding (Jun 2026)

FII

10.73%

Held by 189 FIIs

DII

37.37%

Held by 54 DIIs

Promoter

44.72%

Why is Ipca Laboratories Ltd falling/rising?

15-Aug-2026

As of 14-Aug, Ipca Laboratories Ltd's stock price is declining, currently at 1,728.00, reflecting a 3.82% decrease after a trend reversal. Despite strong annual performance, recent movements indicate a short-term correction and underperformance relative to its sector.

As of 14-Aug, Ipca Laboratories Ltd's stock price is falling, currently at 1,728.00, which reflects a decrease of 68.6 points or 3.82%. This decline follows a trend reversal after three consecutive days of gains. The stock has underperformed its sector by 2.96% today and reached an intraday low of Rs 1720.45, marking a drop of 4.24%. <BR><BR>Despite the stock's strong performance over the year, generating a return of 26.33%, and positive financial indicators such as a 36.65% growth in net profit and a high operating cash flow, the recent price movement suggests a short-term correction. The stock is currently trading below its 5-day and 20-day moving averages, indicating a potential weakening in momentum. Additionally, while there has been a significant increase in delivery volume, up 299.44% against the 5-day average, this may not be enough to counteract the current downward pressure on the stock price. <BR><BR>Overall, the combination of recent performance trends, the stock's current positioning relative to moving averages, and the sector underperformance contribute to the observed decline in the stock price of Ipca Laboratories Ltd.

View full answer

Should I buy, sell or hold Ipca Laboratories Ltd?

15-Aug-2026

Who are in the management team of Ipca Labs?

14-Aug-2026

The management team of Ipca Labs includes Premchand Godha (Chairman), A K Jain (Managing Director & CFO), Pranay Godha (CEO), and several independent directors, along with Harish P Kamath as Company Secretary. They are responsible for the company's strategic direction and operations.

The management team of Ipca Labs includes the following key members:<BR><BR>1. **Premchand Godha** - Chairman / Executive Director<BR>2. **A K Jain** - Managing Director and Joint Managing Director & CFO<BR>3. **Pranay Godha** - Executive Director / Managing Director / CEO / Promoter<BR>4. **Prashant Godha** - Executive Director<BR>5. **Anand T Kusre** - Independent Director and Independent Non-Executive Director<BR>6. **Manisha Premnath** - Independent Director and Independent Non-Executive Director<BR>7. **Kamal Kishore Seth** - Independent Director and Independent Non-Executive Director<BR>8. **Narendra Mairpady** - Independent Director and Independent Non-Executive Director<BR>9. **Harish P Kamath** - Company Secretary & Compliance Officer<BR><BR>This team plays a crucial role in guiding the company's strategic direction and operations.

View full answer

What does Ipca Labs do?

14-Aug-2026

Ipca Laboratories Ltd is a mid-cap pharmaceutical company, incorporated in 1949, specializing in pharmaceuticals and biotechnology. As of June 2026, it reported net sales of ₹2,788 Cr and a net profit of ₹402 Cr, with a market cap of ₹45,210 Cr.

Overview:<BR>Ipca Laboratories Ltd is a fully integrated pharmaceutical company operating in the Pharmaceuticals & Biotechnology industry, categorized as a Mid Cap.<BR><BR>History:<BR>Ipca Laboratories Limited was incorporated on 19 October 1949 under the name 'The Indian Pharmaceutical Combine Association Limited.' The latest quarterly results reported net sales and profit for June 2026.<BR><BR>Financial Snapshot:<BR>- Net Sales: 2,788 Cr (Quarterly Results - Jun 2026)<BR>- Net Profit: 402 Cr (Quarterly Results - Jun 2026)<BR>- Market Cap: INR 45,210 Cr (Mid Cap)<BR><BR>Key Metrics:<BR>- P/E: 38.00<BR>- Industry P/E: 37<BR>- Dividend Yield: 0.34%<BR>- Debt Equity: -0.05<BR>- Return on Equity: 14.93%<BR>- Price to Book: 5.54<BR><BR>Contact Details:<BR>Address: 48 Kandivli Industrial Estate, Kandivli (West) Mumbai Maharashtra : 400067<BR>Tel: 91-22-66474444<BR>Email: ipca@ipca.co.in/investors@ipca.com<BR>Website: http://www.ipca.com

View full answer

Who are the peers of the Ipca Labs?

14-Aug-2026

Ipca Labs' peers include Alkem Lab, Glenmark Pharma, Abbott India, Anthem Bioscienc, Gland Pharma, Ajanta Pharma, Glaxosmi. Pharma, Emcure Pharma, Sai Life, and Wockhardt. In terms of management risk, growth, and capital structure, they vary from excellent to below average, with Ipca Labs showing a 1-year return of 31.71%.

Peers: The peers of Ipca Labs are Alkem Lab, Glenmark Pharma, Abbott India, Anthem Bioscienc, Gland Pharma, Ajanta Pharma, Glaxosmi. Pharma, Emcure Pharma, Sai Life, and Wockhardt.<BR><BR>Quality Snapshot: Excellent management risk is observed at Abbott India, Ajanta Pharma, and Glaxosmi. Pharma, while Good management risk is found at Alkem Lab, Glenmark Pharma, Anthem Bioscienc, Gland Pharma, Ipca Labs, and Emcure Pharma. Average management risk is noted at Sai Life and Wockhardt. In terms of Growth, Excellent growth is seen at Anthem Bioscienc and Emcure Pharma, while Average growth is found at Glenmark Pharma and Abbott India, and Below Average growth is observed at Alkem Lab, Gland Pharma, Ipca Labs, and Ajanta Pharma. For Capital Structure, Excellent capital structure is noted at Alkem Lab, Abbott India, Anthem Bioscienc, Gland Pharma, Ajanta Pharma, Ipca Labs, Glaxosmi. Pharma, and Sai Life, while Good capital structure is seen at Glenmark Pharma and Emcure Pharma, and Below Average capital structure is present at Wockhardt.<BR><BR>Return Snapshot: The peer with the highest 1-year return is Sai Life at 60.82%, while Abbott India has the lowest at -16.28%. Ipca Labs has a 1-year return of 31.71%, which is significantly higher than Abbott India but lower than Sai Life. Additionally, no peers have a negative six-month return.

View full answer

How big is Ipca Labs?

14-Aug-2026

As of 14th August, Ipca Laboratories Ltd has a market capitalization of 43,855.31 Cr, with recent net sales of 10,125.58 Cr and net profit of 1,309.80 Cr over the last four quarters.

As of 14th August, <BR><BR>Market Cap: Ipca Laboratories Ltd has a market capitalization of 43,855.31 Cr, categorizing it as a Mid Cap company.<BR><BR>Recent Quarterly Performance: The sum of Net Sales for the latest 4 quarters is 10,125.58 Cr, while the sum of Net Profit for the same period is 1,309.80 Cr.<BR><BR>Balance Sheet Snapshot: The reporting period is March 2026, with Shareholder's Funds amounting to 8,063.81 Cr and Total Assets totaling 12,349.65 Cr.

View full answer

Are Ipca Laboratories Ltd latest results good or bad?

13-Aug-2026

Ipca Laboratories Ltd's latest results show strong year-on-year growth with a 340.98% increase in net profit, but sequentially, both profit and revenue declined, raising concerns about margin sustainability. Overall, the results are good year-on-year but troubling in terms of quarter-on-quarter performance.

Ipca Laboratories Ltd's latest results present a mixed picture. On one hand, the company reported a significant year-on-year increase in consolidated net profit, soaring by 340.98% to ₹299.07 crore, and a 6.31% rise in revenue to ₹2,388.48 crore. This indicates a strong recovery from previous lows. However, the sequential performance raises concerns, as both net profit and revenue showed declines of 8.34% and 0.17% respectively compared to the previous quarter.<BR><BR>The operating margin also experienced a notable decline, dropping from 22.29% in the previous quarter to 20.26%. This margin compression, despite stable revenue, suggests rising cost pressures or unfavorable shifts in product mix, which could be a red flag for investors.<BR><BR>Overall, while the year-on-year growth figures are impressive, the sequential decline in profitability and margins indicates challenges that the company needs to address. Investors reacted negatively to these results, as reflected in the stock's decline following the announcement. Therefore, the latest results can be characterized as good in terms of year-on-year growth but concerning when looking at the quarter-on-quarter performance and margin sustainability.

View full answer

Is Ipca Labs technically bullish or bearish?

02-Dec-2025

As of December 1, 2025, the technical trend for Ipca Labs is mildly bearish, influenced by weak daily moving averages and monthly indicators, despite a bullish weekly MACD and mildly bullish Bollinger Bands.

As of 1 December 2025, the technical trend has changed from sideways to mildly bearish. The current stance is mildly bearish, driven by the daily moving averages indicating weakness and the monthly MACD showing a mildly bearish outlook. While the weekly MACD is bullish, the overall sentiment is tempered by the monthly indicators, including the KST and Dow Theory, which are also mildly bearish. The Bollinger Bands present a mildly bullish signal on both weekly and monthly time frames, but this is overshadowed by the bearish signals in moving averages and the lack of strong momentum in the RSI. Overall, the technical indicators suggest a cautious approach in the current market environment for Ipca Labs.

View full answer

How has been the historical performance of Ipca Labs?

13-Nov-2025

Ipca Labs has exhibited consistent growth in net sales and profitability, with net sales increasing from ₹3,773.18 Cr in Mar'19 to ₹8,939.59 Cr in Mar'25, and profit after tax rising from ₹444.03 Cr to ₹787.53 Cr during the same period. The company's financial performance reflects resilience, with improved operating profit and positive cash flow.

Answer:<BR>The historical performance of Ipca Labs shows a consistent growth trajectory in net sales and profitability over the years, with a notable increase in recent periods.<BR><BR>Breakdown:<BR>Ipca Labs has demonstrated significant growth in net sales, rising from 3,773.18 Cr in Mar'19 to 8,939.59 Cr in Mar'25. This upward trend is reflected in total operating income, which also increased from 3,773.18 Cr in Mar'19 to 8,939.59 Cr in Mar'25. The total expenditure has risen correspondingly, from 3,081.30 Cr in Mar'19 to 7,213.45 Cr in Mar'25, yet the operating profit (PBDIT) has shown improvement, climbing from 749.56 Cr in Mar'19 to 1,818.94 Cr in Mar'25. Profit before tax has also increased from 548.27 Cr in Mar'19 to 1,131.14 Cr in Mar'25, while profit after tax reached 787.53 Cr in Mar'25, up from 444.03 Cr in Mar'19. The earnings per share (EPS) rose from 35.21 in Mar'19 to 29.08 in Mar'25, indicating a strong performance despite fluctuations in profitability. The company's total assets have expanded from 5,257.82 Cr in Mar'20 to 11,743.63 Cr in Mar'25, with total liabilities increasing from 5,257.82 Cr to 11,743.63 Cr during the same period. Cash flow from operating activities has improved, reaching 1,321.00 Cr in Mar'25 compared to 570.00 Cr in Mar'20, while net cash inflow turned positive at 168.00 Cr in Mar'25 after a negative outflow in the previous year. Overall, Ipca Labs has shown resilience and growth in its financial performance over the years.

View full answer

Is Ipca Labs overvalued or undervalued?

03-Sep-2025

As of September 2, 2025, Ipca Labs is fairly valued with a PE ratio of 39.19, an EV to EBITDA of 19.94, and a PEG ratio of 0.66, making it an attractive investment compared to its peers, Sun Pharma and Divi's Lab, which are considered expensive.

As of 2 September 2025, the valuation grade for Ipca Labs has moved from expensive to fair. The company is currently fairly valued based on its financial metrics. Key ratios include a PE ratio of 39.19, an EV to EBITDA of 19.94, and a PEG ratio of 0.66, indicating a relatively attractive growth potential compared to its price.<BR><BR>In comparison to its peers, Ipca Labs stands out with a fair valuation while Sun Pharma is considered expensive with a PE of 32.69 and Divi's Lab is very expensive with a PE of 70.48. Notably, the company's return over the past year has been slightly better than the Sensex, which aligns with its fair valuation status. Overall, Ipca Labs presents a balanced investment opportunity within the pharmaceuticals and biotechnology sector.

View full answer

Who are the top shareholders of the Ipca Labs?

17-Jul-2025

The top shareholders of Ipca Labs include promoters holding 21.47%, mutual funds with a collective 29.63% (led by HDFC Mid-cap Opportunities Fund at 8.47%), foreign institutional investors at 10.76%, and individual investors at 6.81%.

The top shareholders of Ipca Labs include a mix of promoters, mutual funds, and foreign institutional investors. The majority shareholders are the promoters, with Kaygee Investments Private Limited holding the largest share at 21.47%. Mutual funds collectively hold 29.63% through 33 schemes, with HDFC Mutual Fund's HDFC Mid-cap Opportunities Fund being the highest public shareholder at 8.47%. Additionally, foreign institutional investors (FIIs) hold 10.76% of the company, while individual investors account for 6.81%.

View full answer

When is the next results date for Ipca Labs?

06-Jun-2025

No Upcoming Board Meetings

Has Ipca Labs declared dividend?

06-Jun-2025

Ipca Laboratories Ltd has declared a 200% dividend, amounting to ₹2 per share, with an ex-date of November 27, 2024. The dividend yield is 0.29%, and the company has shown strong total returns over various periods, particularly in the long term.

Ipca Laboratories Ltd has declared a 200% dividend.<BR><BR>Dividend Details:<BR>- Percentage announced: 200%<BR>- Amount per share: 2 per share<BR>- Ex-date: Nov-27-2024<BR><BR>Dividend Yield: 0.29%.<BR><BR>Total Returns by Period:<BR>In the last 6 months, the price return was -9.73%, the dividend return was 0%, resulting in a total return of -9.73%.<BR><BR>Over the past year, the price return was 19.48%, the dividend return was 0.34%, leading to a total return of 19.82%.<BR><BR>In the 2-year period, the price return was 85.62%, the dividend return was 0.82%, culminating in a total return of 86.44%.<BR><BR>For the 3-year period, the price return was 60.69%, the dividend return was 1.12%, resulting in a total return of 61.81%.<BR><BR>In the last 4 years, the price return was 34.76%, the dividend return was 1.79%, leading to a total return of 36.55%.<BR><BR>Over the past 5 years, the price return was 84.96%, the dividend return was 3.14%, resulting in a total return of 88.1%.<BR><BR>Overall, Ipca Laboratories Ltd has declared a significant dividend while also demonstrating strong total returns over various periods, particularly in the longer term. The dividend yield remains modest, indicating a balanced approach between price appreciation and dividend distribution.

View full answer
iScoreScore
Click here to find our call on this stock
Strong Sell
Sell
Hold
Buy
Strong Buy

Dashboard

1

Company has a Debt to Equity ratio (avg) of 0.03 times

 
2

With a growth in Net Profit of 36.65%, the company declared Very Positive results in Jun 26

3

With ROE of 14.9, it has a Fair valuation with a 5.4 Price to Book Value

4

High Institutional Holdings at 48.1%

5

Consistent Returns over the last 3 years

stock-summaryMojo Parameters

Mojo Parameters

Loading Valuation Snapshot...

Stock DNA

stock-summary
Industry

Pharmaceuticals & Biotechnology

stock-summary
Market cap

INR 44,571 Cr (Mid Cap)

stock-summary
P/E

32.00

stock-summary
Industry P/E

37

stock-summary
Dividend Yield

0.33%

stock-summary
Debt Equity

-0.05

stock-summary
Return on Equity

14.93%

stock-summary
Price to Book

5.65

Revenue and Profits:
Net Sales:
2,788 Cr
(Quarterly Results - Jun 2026)
Net Profit:
402 Cr
stock-summaryTotal Returns
Total Returns (Price + Dividend) stock-summary
Dividend Yield (0.33%)
TimePeriod
Price Return
Dividend Return
Total Return
3 Months
9.18%
0.36%
9.54%
6 Months
16.09%
0.40%
16.49%
1 Year
26.33%
0.44%
26.77%
2 Years
27.93%
0.72%
28.65%
3 Years
95.5%
1.60%
97.1%
4 Years
86.21%
2.03%
88.24%
5 Years
45.31%
1.70%
47.01%

Latest dividend: 6.006743904547811 per share ex-dividend date: Aug-07-2026

Risk Adjusted Returns v/s stock-summary
Returns Beta
Icon
Beta has not been calculated since enough price history is not available
stock-summaryNews & Corporate Actions

News

Ipca Laboratories Gains 3.74%: 5 Key Factors Driving the Week’s Momentum

Key Events This Week

10 Aug: Stock opens at Rs.1,686.20, down 2.92%

11 Aug: Mojo Grade upgraded from Hold to Buy; price rises 3.74% to Rs.1,749.30

12 Aug: Technical momentum shifts bullish; valuation grade moves from fair to expensive

14 Aug: Reports very positive quarterly financial performance; stock closes at Rs.1,733.65

Announcements stock-summary

Announcement under Regulation 30 (LODR)-Analyst / Investor Meet - Intimation

06-Aug-2026 | Source : BSE

Conference Call to discuss Q1FY27 Results

Board Meeting Intimation for Standalone And Consolidated Financial Results For 1St Quarter Ended 30Th June 2026

28-Jul-2026 | Source : BSE

Ipca Laboratories Ltdhas informed BSE that the meeting of the Board of Directors of the Company is scheduled on 13/08/2026 inter alia to consider and approve Standalone and Consolidated Financial Results for 1st quarter ended 30th June 2026

Intimation Of Web Link To Non-Email Cases

17-Jul-2026 | Source : BSE

Intimation of web link to non-email cases

Corporate Actions stock-summary

stock-summary
BOARD MEETING

No Upcoming Board Meetings

stock-summary
DIVIDEND

Ipca Laboratories Ltd has declared 600% dividend, ex-date: 07 Aug 26

stock-summary
SPLITS

Ipca Laboratories Ltd has announced 1:2 stock split, ex-date: 10 Jan 22

stock-summary
BONUS

No Bonus history available

stock-summary
RIGHTS

No Rights history available

stock-summaryKey Factors

Quality key factors stock-summary

Factor
Value
Sales Growth (5y)
13.18%
EBIT Growth (5y)
9.25%
EBIT to Interest (avg)
26.57
Debt to EBITDA (avg)
0.88
Net Debt to Equity (avg)
-0.05
Sales to Capital Employed (avg)
0.98
Tax Ratio
23.94%
Dividend Payout Ratio
0
Pledged Shares
0
Institutional Holding
48.10%
ROCE (avg)
17.41%
ROE (avg)
11.91%

Valuation key factors

Factor
Value
P/E Ratio
32
Industry P/E
37
Price to Book Value
5.44
EV to EBIT
24.10
EV to EBITDA
19.47
EV to Capital Employed
5.66
EV to Sales
4.29
PEG Ratio
0.58
Dividend Yield
0.35%
ROCE (Latest)
20.33%
ROE (Latest)
14.93%

Technicals key factors

Indicator
Weekly
Monthly
MACD
Bullish
Bullish
RSI
No Signal
No Signal
Bollinger Bands
Mildly Bullish
Mildly Bullish
Moving Averages
Bullish (Daily)
KST
Bullish
Bullish
Dow Theory
Mildly Bearish
Bullish
OBV
No Trend
Bullish
stock-summary Technical Indicator Scale: Bearish, Mildly Bearish, Sideways, Mildly Bullish, Bullish  Turned 
stock-summaryShareholding
Shareholding Snapshot : Jun 2026stock-summary
Shareholding Compare (%holding) stock-summary
Majority shareholders

Promoters

Pledged Promoter Holdings

None

Mutual Funds

Held by 33 Schemes (31.15%)

FIIs

Held by 189 FIIs (10.73%)

Promoter with highest holding

Kaygee Investments Private Limited (25.49%)

Highest Public shareholder

Hdfc Mutual Fund (9.54%)

Individual Investors Holdings

5.76%

stock-summaryFinancial
[
  {
    "link": "quarterly",
    "btn_text": "All Quarterly Results",
    "header": "Quarterly Results Snapshot (Consolidated) - Jun'26 - QoQ",
    "rhs": [
      {
        "prefix": "Net Sales ",
        "suffix": "QoQ Growth in quarter ended Jun 2026 is 16.73% vs -0.17% in Mar 2026",
        "dir": 1
      },
      {
        "prefix": "Consolidated Net Profit ",
        "suffix": "QoQ Growth in quarter ended Jun 2026 is 34.38% vs -8.34% in Mar 2026",
        "dir": 1
      }
    ],
    "table": {
      "header": [
        "Jun'26",
        "Mar'26",
        "Change(%)"
      ],
      "body": [
        {
          "field": "Net Sales",
          "val1": "2,788.10",
          "val2": "2,388.48",
          "chgp": "16.73%",
          "chgp_class": "positive"
        },
        {
          "field": "Operating Profit (PBDIT) excl Other Income",
          "val1": "669.51",
          "val2": "483.87",
          "chgp": "38.37%",
          "chgp_class": "positive"
        },
        {
          "field": "Interest",
          "val1": "11.88",
          "val2": "20.20",
          "chgp": "-41.19%",
          "chgp_class": "positive"
        },
        {
          "field": "Exceptional Items",
          "val1": "0.00",
          "val2": "-45.82",
          "chgp": "100.00%",
          "chgp_class": "positive"
        },
        {
          "field": "Consolidate Net Profit",
          "val1": "401.89",
          "val2": "299.07",
          "chgp": "34.38%",
          "chgp_class": "positive"
        },
        {
          "field": "Operating Profit Margin (Excl OI)",
          "val1": "24.01%",
          "val2": "20.26%",
          "chgp": "3.75%",
          "chgp_class": "positive"
        }
      ]
    }
  },
  {
    "link": "half-yearly",
    "btn_text": "All Half Yearly Results",
    "header": "Half Yearly Results Snapshot (Consolidated) - Sep'25",
    "rhs": [
      {
        "prefix": "Net Sales ",
        "suffix": " Growth in half year ended Sep 2025 is 9.39% vs 22.89% in Sep 2024",
        "dir": -1
      },
      {
        "prefix": "Consolidated Net Profit ",
        "suffix": " Growth in half year ended Sep 2025 is 22.30% vs 36.98% in Sep 2024",
        "dir": -1
      }
    ],
    "table": {
      "header": [
        "Sep'25",
        "Sep'24",
        "Change(%)"
      ],
      "body": [
        {
          "field": "Net Sales",
          "val1": "4,865.35",
          "val2": "4,447.53",
          "chgp": "9.39%",
          "chgp_class": "positive"
        },
        {
          "field": "Operating Profit (PBDIT) excl Other Income",
          "val1": "961.34",
          "val2": "834.20",
          "chgp": "15.24%",
          "chgp_class": "positive"
        },
        {
          "field": "Interest",
          "val1": "38.12",
          "val2": "46.61",
          "chgp": "-18.21%",
          "chgp_class": "positive"
        },
        {
          "field": "Exceptional Items",
          "val1": "-58.26",
          "val2": "0.00",
          "chgp": "",
          "chgp_class": "neutral"
        },
        {
          "field": "Consolidate Net Profit",
          "val1": "515.78",
          "val2": "421.72",
          "chgp": "22.30%",
          "chgp_class": "positive"
        },
        {
          "field": "Operating Profit Margin (Excl OI)",
          "val1": "19.76%",
          "val2": "18.76%",
          "chgp": "1.00%",
          "chgp_class": "positive"
        }
      ]
    }
  },
  {
    "link": "nine-monthly",
    "btn_text": "All Nine Monthly Results",
    "header": "Nine Monthly Results Snapshot (Consolidated) - Dec'25",
    "rhs": [
      {
        "prefix": "Net Sales ",
        "suffix": "YoY Growth in nine months ended Dec 2025 is 8.44% vs 18.00% in Dec 2024",
        "dir": -1
      },
      {
        "prefix": "Consolidated Net Profit ",
        "suffix": "YoY Growth in nine months ended Dec 2025 is 25.71% vs 37.33% in Dec 2024",
        "dir": -1
      }
    ],
    "table": {
      "header": [
        "Dec'25",
        "Dec'24",
        "Change(%)"
      ],
      "body": [
        {
          "field": "Net Sales",
          "val1": "7,257.85",
          "val2": "6,692.90",
          "chgp": "8.44%",
          "chgp_class": "positive"
        },
        {
          "field": "Operating Profit (PBDIT) excl Other Income",
          "val1": "1,494.69",
          "val2": "1,297.28",
          "chgp": "15.22%",
          "chgp_class": "positive"
        },
        {
          "field": "Interest",
          "val1": "55.74",
          "val2": "63.42",
          "chgp": "-12.11%",
          "chgp_class": "positive"
        },
        {
          "field": "Exceptional Items",
          "val1": "-40.61",
          "val2": "0.00",
          "chgp": "",
          "chgp_class": "neutral"
        },
        {
          "field": "Consolidate Net Profit",
          "val1": "842.05",
          "val2": "669.86",
          "chgp": "25.71%",
          "chgp_class": "positive"
        },
        {
          "field": "Operating Profit Margin (Excl OI)",
          "val1": "20.59%",
          "val2": "19.38%",
          "chgp": "1.21%",
          "chgp_class": "positive"
        }
      ]
    }
  },
  {
    "link": "annual",
    "btn_text": "All Annual Results",
    "header": "Annual Results Snapshot (Consolidated) - Mar'26",
    "rhs": [
      {
        "prefix": "Net Sales ",
        "suffix": "YoY Growth in year ended Mar 2026 is 7.91% vs 16.02% in Mar 2025",
        "dir": -1
      },
      {
        "prefix": "Consolidated Net Profit ",
        "suffix": "YoY Growth in year ended Mar 2026 is 54.69% vs 34.77% in Mar 2025",
        "dir": 1
      }
    ],
    "table": {
      "header": [
        "Mar'26",
        "Mar'25",
        "Change(%)"
      ],
      "body": [
        {
          "field": "Net Sales",
          "val1": "9,646.33",
          "val2": "8,939.59",
          "chgp": "7.91%",
          "chgp_class": "positive"
        },
        {
          "field": "Operating Profit (PBDIT) excl Other Income",
          "val1": "1,978.56",
          "val2": "1,726.14",
          "chgp": "14.62%",
          "chgp_class": "positive"
        },
        {
          "field": "Interest",
          "val1": "75.94",
          "val2": "84.93",
          "chgp": "-10.59%",
          "chgp_class": "positive"
        },
        {
          "field": "Exceptional Items",
          "val1": "-86.43",
          "val2": "-205.05",
          "chgp": "57.85%",
          "chgp_class": "positive"
        },
        {
          "field": "Consolidate Net Profit",
          "val1": "1,141.12",
          "val2": "737.68",
          "chgp": "54.69%",
          "chgp_class": "positive"
        },
        {
          "field": "Operating Profit Margin (Excl OI)",
          "val1": "20.51%",
          "val2": "19.31%",
          "chgp": "1.20%",
          "chgp_class": "positive"
        }
      ]
    }
  }
]

Quarterly Results Snapshot (Consolidated) - Jun'26 - QoQstock-summary

Jun'26
Mar'26
Change(%)
Net Sales
2,788.10
2,388.48
16.73%
Operating Profit (PBDIT) excl Other Income
669.51
483.87
38.37%
Interest
11.88
20.20
-41.19%
Exceptional Items
0.00
-45.82
100.00%
Consolidate Net Profit
401.89
299.07
34.38%
Operating Profit Margin (Excl OI)
24.01%
20.26%
3.75%
Values in Rs Cr.
Direction Arrows
Net Sales

QoQ Growth in quarter ended Jun 2026 is 16.73% vs -0.17% in Mar 2026

Direction Arrows
Consolidated Net Profit

QoQ Growth in quarter ended Jun 2026 is 34.38% vs -8.34% in Mar 2026

Half Yearly Results Snapshot (Consolidated) - Sep'25stock-summary

Sep'25
Sep'24
Change(%)
Net Sales
4,865.35
4,447.53
9.39%
Operating Profit (PBDIT) excl Other Income
961.34
834.20
15.24%
Interest
38.12
46.61
-18.21%
Exceptional Items
-58.26
0.00
Consolidate Net Profit
515.78
421.72
22.30%
Operating Profit Margin (Excl OI)
19.76%
18.76%
1.00%
Values in Rs Cr.
Direction Arrows
Net Sales

Growth in half year ended Sep 2025 is 9.39% vs 22.89% in Sep 2024

Direction Arrows
Consolidated Net Profit

Growth in half year ended Sep 2025 is 22.30% vs 36.98% in Sep 2024

Nine Monthly Results Snapshot (Consolidated) - Dec'25stock-summary

Dec'25
Dec'24
Change(%)
Net Sales
7,257.85
6,692.90
8.44%
Operating Profit (PBDIT) excl Other Income
1,494.69
1,297.28
15.22%
Interest
55.74
63.42
-12.11%
Exceptional Items
-40.61
0.00
Consolidate Net Profit
842.05
669.86
25.71%
Operating Profit Margin (Excl OI)
20.59%
19.38%
1.21%
Values in Rs Cr.
Direction Arrows
Net Sales

YoY Growth in nine months ended Dec 2025 is 8.44% vs 18.00% in Dec 2024

Direction Arrows
Consolidated Net Profit

YoY Growth in nine months ended Dec 2025 is 25.71% vs 37.33% in Dec 2024

Annual Results Snapshot (Consolidated) - Mar'26stock-summary

Mar'26
Mar'25
Change(%)
Net Sales
9,646.33
8,939.59
7.91%
Operating Profit (PBDIT) excl Other Income
1,978.56
1,726.14
14.62%
Interest
75.94
84.93
-10.59%
Exceptional Items
-86.43
-205.05
57.85%
Consolidate Net Profit
1,141.12
737.68
54.69%
Operating Profit Margin (Excl OI)
20.51%
19.31%
1.20%
Values in Rs Cr.
Direction Arrows
Net Sales

YoY Growth in year ended Mar 2026 is 7.91% vs 16.02% in Mar 2025

Direction Arrows
Consolidated Net Profit

YoY Growth in year ended Mar 2026 is 54.69% vs 34.77% in Mar 2025

stock-summaryCompany CV
About Ipca Laboratories Ltd stock-summary
stock-summary
Ipca Laboratories Ltd
Mid Cap
Pharmaceuticals & Biotechnology
Ipca Laboratories Limited (IPCA) was incorporated on 19 October, 1949 under the name of 'The Indian Pharmaceutical Combine Association Limited.' Ipca is a fully integrated, pharmaceutical company manufacturing and marketing over 350 formulations and 80 API's covering various therapeutic segments. The Company exports formulations as well as APIs to several Asian countries. The Company has 16 manufacturing units in India manufacturing API's and formulations for the world market.
Company Coordinates stock-summary
Company Details
48 Kandivli Industrial Estate, Kandivli (West) Mumbai Maharashtra : 400067
stock-summary
Tel: 91-22-66474444
stock-summary
ipca@ipca.co.in/investors@ipca.com
Registrar Details
Link Intime India Pvt Ltd, C-13 Pannalal Silk Compound, L B S Marg, Bhandup , Mumbai