
Compare Anthem Bioscienc with Similar Stocks
Dashboard
Strong Long Term Fundamental Strength with an average Return on Equity (ROE) of 19.93%
- Healthy long term growth as Operating profit has grown by an annual rate 44.32%
- The company is Net-Debt Free
The company declared positive results in Mar'26 after negative results in Dec'25
Increasing Participation by Institutional Investors
Company is among the highest 1% of companies rated by MarketsMojo across all 4,000 stocks
Stock DNA
Pharmaceuticals & Biotechnology
INR 43,583 Cr (Mid Cap)
71.00
36
0.26%
-0.28
21.62%
13.61
Total Returns (Price + Dividend) 
Latest dividend: 2.004032520325203 per share ex-dividend date: Jun-25-2026
Risk Adjusted Returns v/s
Returns Beta

News

Anthem Biosciences Ltd is Rated Buy
Anthem Biosciences Ltd is rated Buy by MarketsMOJO, with this rating last updated on 21 May 2026. While the rating change occurred on that date, the analysis and financial metrics discussed here reflect the company’s current position as of 05 July 2026, providing investors with the most up-to-date insight into the stock’s fundamentals, valuation, financial trends, and technical outlook.
Read full news article
Anthem Biosciences Ltd Technical Momentum Shifts Signal Mildly Bullish Outlook
Anthem Biosciences Ltd has experienced a notable shift in its technical momentum, moving from a bullish to a mildly bullish stance as of early July 2026. This change is underscored by mixed signals from key technical indicators such as MACD, RSI, moving averages, and Bollinger Bands, reflecting a nuanced market sentiment amid the pharmaceuticals and biotechnology sector.
Read full news article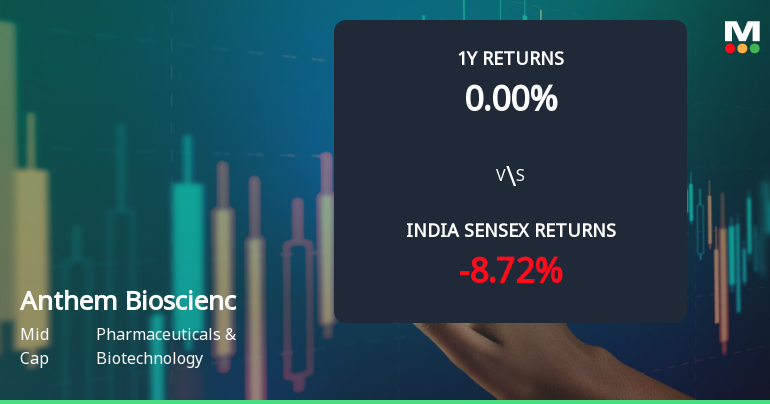
Anthem Biosciences Ltd Technical Momentum Shifts Signal Bullish Outlook
Anthem Biosciences Ltd has demonstrated a marked improvement in price momentum, shifting from a mildly bullish to a bullish technical trend, supported by a confluence of positive signals across key indicators such as MACD, RSI, Bollinger Bands, and moving averages. This technical resurgence coincides with a significant upgrade in its Mojo Grade from Sell to Buy, reflecting growing investor confidence in the mid-cap pharmaceutical and biotechnology firm.
Read full news article Announcements
Announcement under Regulation 30 (LODR)-Credit Rating
03-Jul-2026 | Source : BSEIntimation of Revision in Credit Rating
Announcement Under Regulation 30 (LODR)- Newspaper Publication
01-Jul-2026 | Source : BSENewspaper advertisement regarding the completion of dispatch of notice of the 20th Annual General Meeting of the Company
Reg. 34 (1) Annual Report.
30-Jun-2026 | Source : BSEAnnual Report for the FY 2025-26
Corporate Actions

No Upcoming Board Meetings

Anthem Biosciences Ltd has declared 100% dividend, ex-date: 25 Jun 26

No Splits history available

No Bonus history available

No Rights history available
Quality key factors
Valuation key factors
Technicals key factors
 Technical Indicator Scale: Bearish, Mildly Bearish, Sideways, Mildly Bullish, Bullish Turned
 Shareholding Snapshot : Mar 2026
Shareholding Compare (%holding)
Promoters
None
Held by 27 Schemes (10.12%)
Held by 37 FIIs (1.28%)
Ajay Bhardwaj (42.53%)
Portsmouth Technologies Llc . (2.74%)
9.38%
Quarterly Results Snapshot (Standalone) - Mar'26 - QoQ

QoQ Growth in quarter ended Mar 2026 is 39.83% vs -24.56% in Dec 2025
QoQ Growth in quarter ended Mar 2026 is 88.79% vs -43.50% in Dec 2025
Half Yearly Results Snapshot (Standalone) - Sep'25
Not Applicable: The company has declared_date for only one period
Not Applicable: The company has declared_date for only one period
Nine Monthly Results Snapshot (Standalone) - Dec'25
Not Applicable: The company has declared_date for only one period
Not Applicable: The company has declared_date for only one period
Annual Results Snapshot (Consolidated) - Mar'26

YoY Growth in year ended Mar 2026 is 15.17% vs 29.96% in Mar 2025
YoY Growth in year ended Mar 2026 is 31.14% vs 22.86% in Mar 2025
About Anthem Biosciences Ltd

Company Coordinates


