
Compare Rajkamal Synth. with Similar Stocks
Dashboard
Weak Long Term Fundamental Strength with a -3.00% CAGR growth in Operating Profits over the last 5 years
- Company's ability to service its debt is weak with a poor EBIT to Interest (avg) ratio of 0.27
- The company has been able to generate a Return on Equity (avg) of 2.40% signifying low profitability per unit of shareholders funds
Flat results in Mar 26
Below par performance in long term as well as near term
Stock DNA
Garments & Apparels
INR 19 Cr (Micro Cap)
55.00
25
0.00%
-0.14
2.14%
1.36
Total Returns (Price + Dividend) 
Rajkamal Synth. for the last several years.
Risk Adjusted Returns v/s
Returns Beta

News

Rajkamal Synthetics Ltd Valuation Shifts to Fair Amidst Market Pressure
Rajkamal Synthetics Ltd, a micro-cap player in the Garments & Apparels sector, has witnessed a notable shift in its valuation parameters, moving from an expensive to a fair valuation grade. This change reflects evolving market perceptions amid a challenging price performance and subdued return ratios, prompting a reassessment of its price attractiveness relative to peers and historical benchmarks.
Read full news article
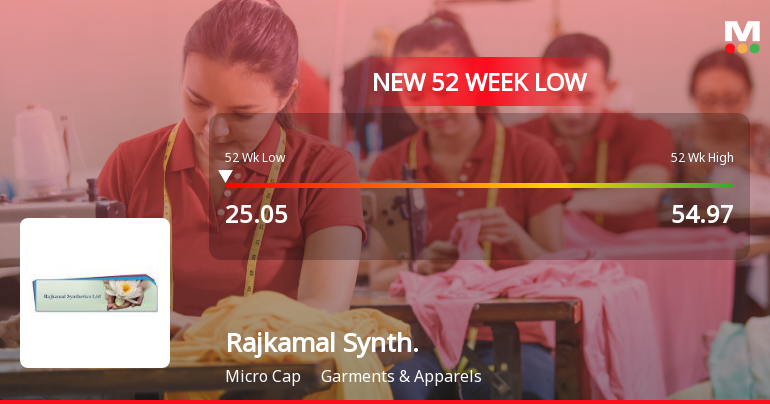
Rajkamal Synthetics Ltd Falls to 52-Week Low of Rs 27.26 as Sell-Off Deepens
For the ninth consecutive session, Rajkamal Synthetics Ltd has closed lower, culminating in a fresh 52-week low of Rs 27.26 on 25 Jun 2026. This marks a 17.22% decline over this losing streak, underscoring sustained selling pressure despite a broadly positive market backdrop.
Read full news article Announcements
Closure of Trading Window
26-Jun-2026 | Source : BSEIntimation of closure of trading window from July 01 2026 till the conclusion of 48 hours after declaration of Unaudited Financial Results (Standalone and Consolidated) of the Company for the quarter ending June 30 2026.
Announcement under Regulation 30 (LODR)-Newspaper Publication
31-May-2026 | Source : BSEPursuant to Regulation 47 of the SEBI (LODR) Regulations 2015 Please find enclosed herewith the Audited Financial Results of the Company for the quarter and financial year ended March 31 2026 published on May 31 2026 in the following newspaper 1. Financial Express (English) 2. Pratahkal (Marathi)
Compliances-Reg.24(A)-Annual Secretarial Compliance
30-May-2026 | Source : BSENon applicability of Annual Secretarial Compliance Report under Regulation 24 (A) of SEBI (LODR) Regulations 2015 for the year ended March 31 2026.
Corporate Actions

No Upcoming Board Meetings

No Dividend history available

No Splits history available

No Bonus history available

No Rights history available
Quality key factors
Valuation key factors
Technicals key factors
 Technical Indicator Scale: Bearish, Mildly Bearish, Sideways, Mildly Bullish, Bullish Turned
 Shareholding Snapshot : Sep 2025
Shareholding Compare (%holding)
Non Institution
None
Held by 0 Schemes
Held by 0 FIIs
Kamal Kishore Somani (9.71%)
Decent Housing Private Limited (7.88%)
53.63%
Quarterly Results Snapshot (Standalone) - Mar'26 - QoQ

QoQ Growth in quarter ended Mar 2026 is -12.78% vs -24.43% in Dec 2025
QoQ Growth in quarter ended Mar 2026 is 40.00% vs -28.57% in Dec 2025
Half Yearly Results Snapshot (Standalone) - Sep'25

Growth in half year ended Sep 2025 is 310.26% vs 310.53% in Sep 2024
Growth in half year ended Sep 2025 is -13.33% vs 87.50% in Sep 2024
Nine Monthly Results Snapshot (Standalone) - Dec'25
YoY Growth in nine months ended Dec 2025 is 445.78% vs 336.84% in Dec 2024
YoY Growth in nine months ended Dec 2025 is 125.00% vs 33.33% in Dec 2024
Annual Results Snapshot (Standalone) - Mar'26
YoY Growth in year ended Mar 2026 is 174.88% vs 417.50% in Mar 2025
YoY Growth in year ended Mar 2026 is 18.18% vs 46.67% in Mar 2025
About Rajkamal Synthetics Ltd

Company Coordinates


