
Compare Constronics with Similar Stocks
Stock DNA
Trading & Distributors
INR 65 Cr (Micro Cap)
21.00
23
0.00%
-0.17
8.01%
1.57
Total Returns (Price + Dividend) 
Constronics for the last several years.
Risk Adjusted Returns v/s
Returns Beta

News
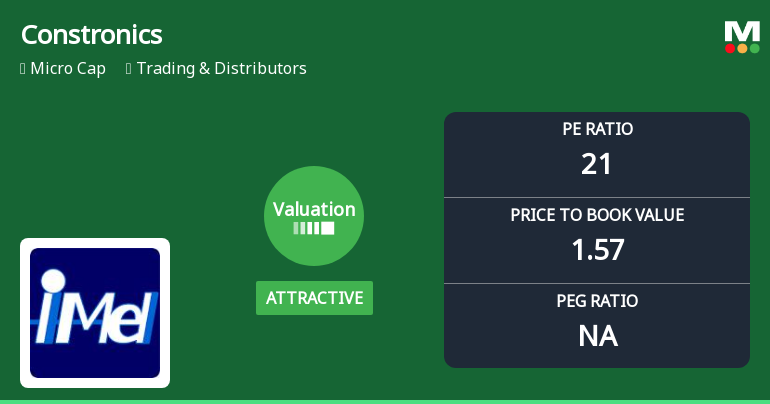
Constronics Infra Ltd Valuation Shifts Signal Changing Market Sentiment
Constronics Infra Ltd, a micro-cap player in the Trading & Distributors sector, has witnessed a notable shift in its valuation parameters, moving from a very attractive to an attractive rating. Despite this improvement, the company’s overall market sentiment remains cautious, reflected in its Strong Sell mojo grade and subdued recent returns compared to the broader Sensex.
Read full news article
Constronics Infra Ltd is Rated Strong Sell
Constronics Infra Ltd is rated Strong Sell by MarketsMOJO, with this rating last updated on 14 February 2026. However, the analysis and financial metrics discussed here reflect the stock's current position as of 29 June 2026, providing investors with the latest insights into the company’s performance and outlook.
Read full news article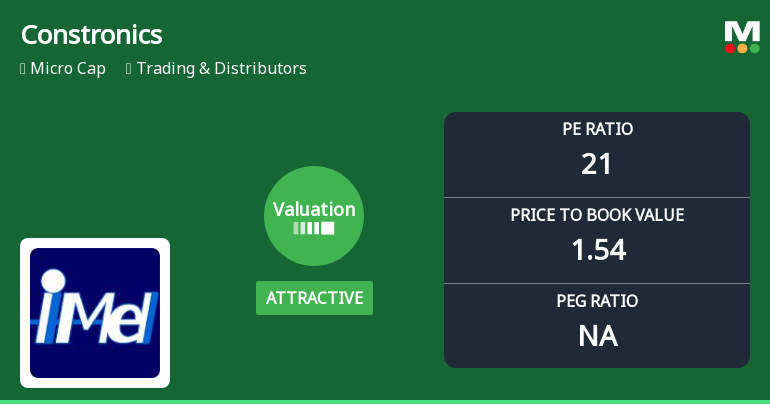
Constronics Infra Ltd Valuation Shifts Signal Mixed Market Sentiment
Constronics Infra Ltd, a micro-cap player in the Trading & Distributors sector, has witnessed a notable shift in its valuation parameters, moving from a very attractive to an attractive rating. Despite this positive change in valuation metrics, the company’s overall market sentiment remains cautious, reflected in its Strong Sell mojo grade and recent price performance.
Read full news article Announcements
Closure of Trading Window
27-Jun-2026 | Source : BSEIntimation for closure of trading window
Update On Financial Results For The Quarter And Year Ended 31St March 2026
12-Jun-2026 | Source : BSEUpdate on Financial Results for the quarter and year ended 31st March 2026 with regard to the Statement on Impact of Audit Qualifications
Compliances-Reg.24(A)-Annual Secretarial Compliance
30-May-2026 | Source : BSEAnnual Secretarial Compliance report pursuant to Regulation 24A of SEBI (LODR) Regulations 2015
Corporate Actions

No Upcoming Board Meetings

No Dividend history available

No Splits history available

No Bonus history available

No Rights history available
Quality key factors
Valuation key factors
Technicals key factors
 Technical Indicator Scale: Bearish, Mildly Bearish, Sideways, Mildly Bullish, Bullish Turned
 Shareholding Snapshot : Mar 2026
Shareholding Compare (%holding)
Non Institution
99.9925
Held by 0 Schemes
Held by 0 FIIs
Vishnu Vardhan (10.63%)
Arulsundaram Nithya (12.33%)
72.61%
Quarterly Results Snapshot (Standalone) - Mar'26 - YoY

YoY Growth in quarter ended Mar 2026 is -61.20% vs 4,507.50% in Mar 2025
YoY Growth in quarter ended Mar 2026 is -75.49% vs 59.38% in Mar 2025
Half Yearly Results Snapshot (Standalone) - Sep'25
Growth in half year ended Sep 2025 is 94.30% vs 8,240.00% in Sep 2024
Growth in half year ended Sep 2025 is 109.48% vs 3,766.67% in Sep 2024
Nine Monthly Results Snapshot (Standalone) - Dec'25
YoY Growth in nine months ended Dec 2025 is 27.37% vs 9,200.00% in Dec 2024
YoY Growth in nine months ended Dec 2025 is 34.91% vs 2,550.00% in Dec 2024
Annual Results Snapshot (Standalone) - Mar'26
YoY Growth in year ended Mar 2026 is -4.63% vs 6,519.48% in Mar 2025
YoY Growth in year ended Mar 2026 is -0.64% vs 334.72% in Mar 2025
About Constronics Infra Ltd

Company Coordinates


