
Compare Greenlam Industr with Similar Stocks
Dashboard
Poor long term growth as Operating profit has grown by an annual rate 9.27% of over the last 5 years
With a growth in Net Profit of 2658.5%, the company declared Outstanding results in Mar 26
With ROCE of 8.2, it has a Fair valuation with a 3.4 Enterprise value to Capital Employed
Majority shareholders : Promoters
Stock DNA
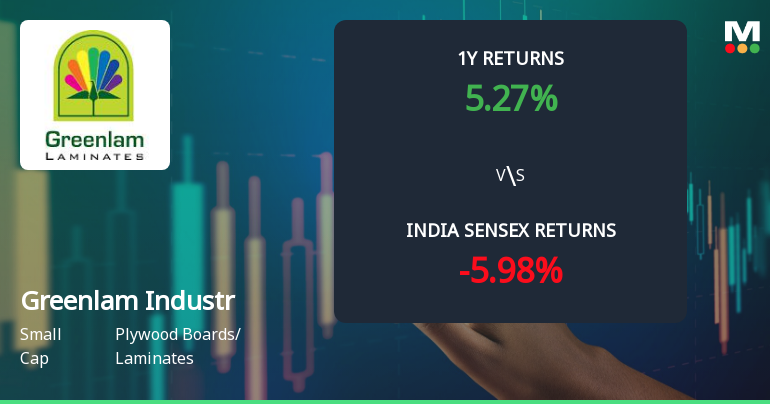
Plywood Boards/ Laminates
INR 6,459 Cr (Small Cap)
103.00
32
0.16%
0.89
5.29%
5.51
Total Returns (Price + Dividend) 
Latest dividend: 0.4 per share ex-dividend date: Jun-20-2025
Risk Adjusted Returns v/s
Returns Beta

News
Greenlam Industries Ltd Technical Momentum Shifts to Sideways; Mixed Indicator Signals Emerge
Greenlam Industries Ltd has exhibited a notable shift in its technical momentum, moving from a mildly bearish stance to a sideways trend, reflecting a nuanced market sentiment. While some indicators signal bullish tendencies, others remain neutral or mildly bearish, underscoring a complex technical landscape for this small-cap plywood boards and laminates player.
Read full news article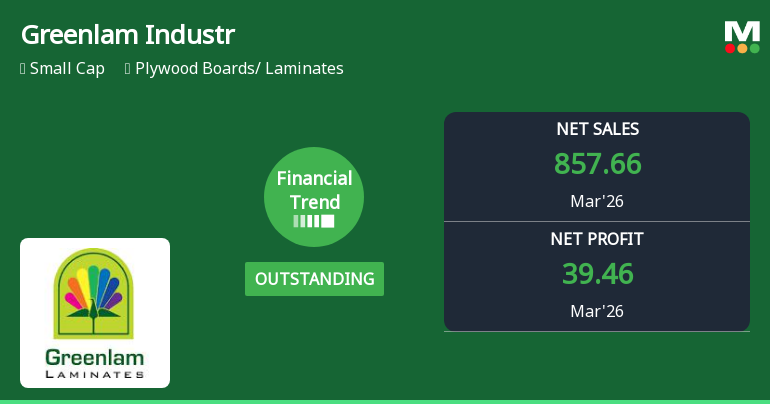
Greenlam Industries Ltd Reports Outstanding Quarterly Performance Amid Financial Trend Upgrade
Greenlam Industries Ltd has delivered an exceptional quarterly performance for March 2026, marking a significant turnaround in its financial trajectory. The company’s financial trend score surged from a negative 17 to an outstanding 30 over the past three months, reflecting robust revenue growth, margin expansion, and improved balance sheet metrics. This performance upgrade has prompted a revision of its Mojo Grade from Sell to Hold, signalling renewed investor confidence in this small-cap plywood and laminates player.
Read full news article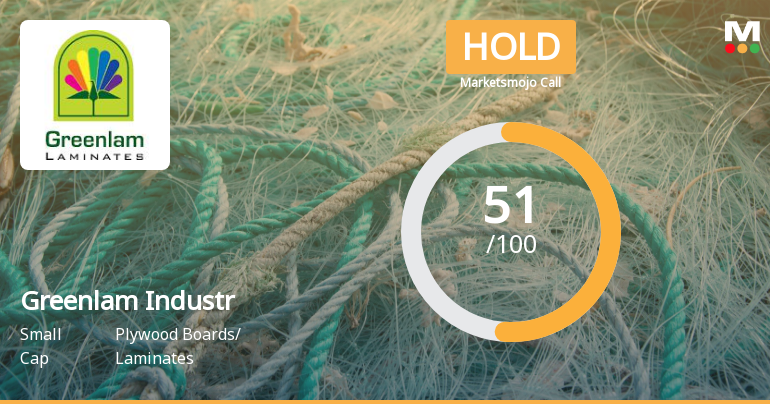
Greenlam Industries Ltd is Rated Hold by MarketsMOJO
Greenlam Industries Ltd is rated 'Hold' by MarketsMOJO, with this rating last updated on 22 May 2026. However, the analysis and financial metrics discussed here reflect the stock's current position as of 10 June 2026, providing investors with the latest insights into the company’s performance and outlook.
Read full news article Announcements
Announcement under Regulation 30 (LODR)-Earnings Call Transcript
09-Jun-2026 | Source : BSETranscript of Earning calls Q4 & FY 26.
Announcement under Regulation 30 (LODR)-Newspaper Publication
09-Jun-2026 | Source : BSENewspaper Publication pertaining to notice sent to shareholders in respect of transfer of shares to the Investor Education Protection Fund (IEPF).
Announcement under Regulation 30 (LODR)-Analyst / Investor Meet - Outcome
04-Jun-2026 | Source : BSEAudio Recording of Earnings Call
Corporate Actions

No Upcoming Board Meetings

Greenlam Industries Ltd has declared 40% dividend, ex-date: 03 Jul 26

Greenlam Industries Ltd has announced 1:5 stock split, ex-date: 10 Feb 22

Greenlam Industries Ltd has announced 1:1 bonus issue, ex-date: 21 Mar 25

No Rights history available
Quality key factors
Valuation key factors
Technicals key factors
 Technical Indicator Scale: Bearish, Mildly Bearish, Sideways, Mildly Bullish, Bullish Turned
 Shareholding Snapshot : Mar 2026
Shareholding Compare (%holding)
Promoters
None
Held by 4 Schemes (11.28%)
Held by 55 FIIs (1.78%)
Sm Greenlam Investments Private Limited (37.78%)
Upnishad Holdings Private Limited (7.4%)
16.65%
Quarterly Results Snapshot (Consolidated) - Mar'26 - YoY

YoY Growth in quarter ended Mar 2026 is 25.80% vs 9.24% in Mar 2025
YoY Growth in quarter ended Mar 2026 is 1,797.12% vs -94.92% in Mar 2025
Half Yearly Results Snapshot (Consolidated) - Sep'25
Growth in half year ended Sep 2025 is 15.29% vs 14.89% in Sep 2024

Growth in half year ended Sep 2025 is -69.08% vs -23.90% in Sep 2024
Nine Monthly Results Snapshot (Consolidated) - Dec'25
YoY Growth in nine months ended Dec 2025 is 15.94% vs 12.20% in Dec 2024
YoY Growth in nine months ended Dec 2025 is -75.15% vs -30.62% in Dec 2024
Annual Results Snapshot (Consolidated) - Mar'26
YoY Growth in year ended Mar 2026 is 18.56% vs 11.40% in Mar 2025
YoY Growth in year ended Mar 2026 is -19.27% vs -49.64% in Mar 2025
About Greenlam Industries Ltd

Company Coordinates


