
Compare Greenlam Industr with Similar Stocks
Dashboard
With a growth in Net Profit of 2658.5%, the company declared Outstanding results in Mar 26
- OPERATING PROFIT TO INTEREST(Q) Highest at 4.70 times
- CASH AND CASH EQUIVALENTS(HY) Highest at Rs 63.97 cr
- DEBT-EQUITY RATIO(HY) Lowest at 0.98 times
With ROCE of 8.2, it has a Fair valuation with a 3.3 Enterprise value to Capital Employed
Stock DNA
Plywood Boards/ Laminates
INR 6,421 Cr (Small Cap)
103.00
60
0.16%
0.89
5.29%
5.50
Total Returns (Price + Dividend) 
Latest dividend: 0.39343415713758756 per share ex-dividend date: Jul-03-2026
Risk Adjusted Returns v/s
Returns Beta

News

Greenlam Industries Ltd is Rated Buy
Greenlam Industries Ltd is rated 'Buy' by MarketsMOJO, with this rating last updated on 13 July 2026. However, the analysis and financial metrics discussed here reflect the stock's current position as of 25 July 2026, providing investors with the latest insights into its performance and outlook.
Read full news article
Greenlam Industries Ltd is Rated Buy
Greenlam Industries Ltd is rated Buy by MarketsMOJO, with this rating last updated on 13 July 2026. While the rating change occurred on that date, the analysis and financial metrics discussed here reflect the stock’s current position as of 25 July 2026, providing investors with the most up-to-date view of the company’s fundamentals, returns, and market standing.
Read full news article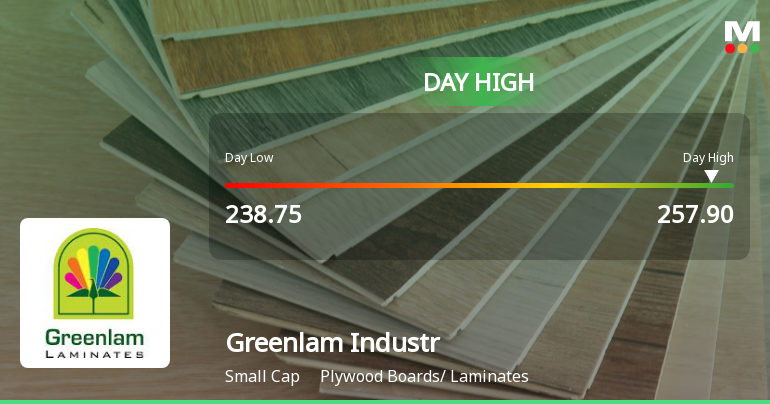
Greenlam Industries Ltd Surges 7.3% to Day's High of Rs 256 — Outperforms Sector by 4.12 Percentage Points
While the Sensex struggled with a modest decline of 0.31%, Greenlam Industries Ltd surged 7.3% on 24 Jul 2026, hitting an intraday high of Rs 256. This 4.12 percentage-point outperformance over its sector underscores a distinctly stock-specific rally rather than a market-wide lift.
Read full news article Announcements
Announcement under Regulation 30 (LODR)-Change in Management
29-Jul-2026 | Source : BSERe-appointment of Independent Director of the Company for a second term
Shareholder Meeting / Postal Ballot-Outcome of AGM
29-Jul-2026 | Source : BSEProceedings of 13th Annual General Meeting of the Company
Shareholder Meeting / Postal Ballot-Scrutinizers Report
29-Jul-2026 | Source : BSE13th AGM Voting Results along with scrutinizers report
Corporate Actions

No Upcoming Board Meetings

Greenlam Industries Ltd has declared 40% dividend, ex-date: 03 Jul 26

Greenlam Industries Ltd has announced 1:5 stock split, ex-date: 10 Feb 22

Greenlam Industries Ltd has announced 1:1 bonus issue, ex-date: 21 Mar 25

No Rights history available
Quality key factors
Valuation key factors
Technicals key factors
 Technical Indicator Scale: Bearish, Mildly Bearish, Sideways, Mildly Bullish, Bullish Turned
 Shareholding Snapshot : Jun 2026
Shareholding Compare (%holding)
Promoters
None
Held by 4 Schemes (8.2%)
Held by 38 FIIs (1.47%)
Sm Greenlam Investments Private Limited (37.78%)
Blue Daimond Properties Pvt Ltd (7.96%)
18.58%
Quarterly Results Snapshot (Consolidated) - Mar'26 - YoY

YoY Growth in quarter ended Mar 2026 is 25.80% vs 9.24% in Mar 2025
YoY Growth in quarter ended Mar 2026 is 1,797.12% vs -94.92% in Mar 2025
Half Yearly Results Snapshot (Consolidated) - Sep'25
Growth in half year ended Sep 2025 is 15.29% vs 14.89% in Sep 2024

Growth in half year ended Sep 2025 is -69.08% vs -23.90% in Sep 2024
Nine Monthly Results Snapshot (Consolidated) - Dec'25
YoY Growth in nine months ended Dec 2025 is 15.94% vs 12.20% in Dec 2024
YoY Growth in nine months ended Dec 2025 is -75.15% vs -30.62% in Dec 2024
Annual Results Snapshot (Consolidated) - Mar'26
YoY Growth in year ended Mar 2026 is 18.56% vs 11.40% in Mar 2025
YoY Growth in year ended Mar 2026 is -19.27% vs -49.64% in Mar 2025
About Greenlam Industries Ltd

Company Coordinates


